

-
摘要: 聚类集成的目的是为了提高聚类结果的准确性、稳定性和鲁棒性.通过集成多个基聚类结果可以产生一个较优的结果.本文提出了一个基于密度峰值的聚类集成模型,主要完成三个方面的工作: 1)在研究已有的各聚类集成算法和模型后发现各基聚类结果可以用密度表示; 2)使用改进的最大信息系数(Rapid computation of the maximal information coefficient,RapidMic)表示各基聚类结果之间的相关性,使用这种相关性来衡量原始数据在经过基聚类器聚类后相互之间的密度关系; 3)改进密度峰值(Density peaks,DP)算法进行聚类集成.最后,使用一些标准数据集对所设计的模型进行评估.实验结果表明,相比经典的聚类集成模型,本文提出的模型聚类集成效果更佳.Abstract: Clustering ensemble aims to improve the accuracy, stability and robustness of clustering results. A good ensemble result is achieved by integrating multiple base clustering results. This paper proposes a clustering ensemble model based on density peaks. First, this paper discovers that the base clustering results can be expressed with density after studying and analyzing the existing clustering algorithms and models. Second, rapid computation of the maximal information coefficient (RapidMic) is introduced to represent the correlation of the base clustering results, which is then used to measure the density of these original datasets after base clustering. Third, the density peak (DP) algorithm is improved for clustering ensemble. Furthermore, some standard datasets are used to evaluate the proposed model. Experimental results show that our model is effective and greatly outperforms some classical clustering ensemble models.
-
Key words:
- Clustering ensemble /
- affinity propagation /
- density peaks /
- similarity matrix
-
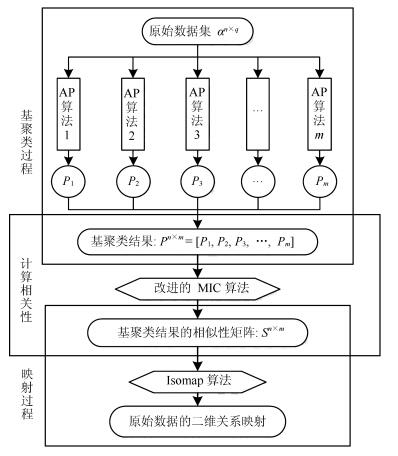
图 1 基于基聚类结果获取原始数据二维关系映射图的过程
Fig. 1 The process of obtaining the two-dimensional relational mapping of original dataset based on clustering results
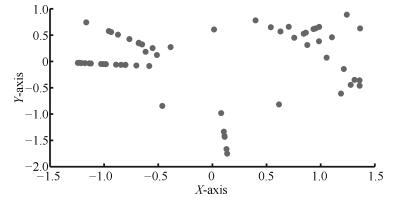
图 2 原始数据的基聚类结果的二维关系映射
Fig. 2 The two-dimensional relational mapping of the base clustering results of original dataset
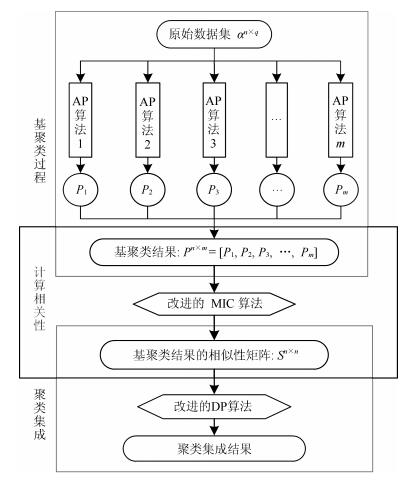
图 3 基于改进的DP算法的聚类集成过程
Fig. 3 The process of cluster ensembling based on improved DP algorithm
表 1 实验数据集的样本、属性和类别数量
Table 1 The number of instances, features and classes of datasets
ID Datasets Number of instances Number of features Number of classes 1 Aerosol 905 892 3 2 Amber 880 892 3 3 Ambulances 930 892 3 4 Aquarium 922 892 3 5 Balloon 830 892 3 6 Banner 860 892 3 7 Baobab 900 892 3 8 Basket 892 892 3 9 Bateau 900 892 3 10 Bathroom 924 892 3 11 Bed 888 892 3 12 Beret 876 892 3 13 Beverage 873 892 3 14 Bicycle 844 892 3 15 Birthdaycake 932 892 3 16 Blog 943 892 3 17 Blood 866 892 3 18 Boat 857 892 3 19 Bonbon 874 892 3 20 Bonsai 867 892 3  下载: 导出CSV
表 2 平均准确率和标准差(每个数据集的最大准确率加粗显示.)
Table 2 Average MPs and standard deviations (The highest MP among different algorithms on each dataset is bolded.)
ID AP-average AP-max CSPA HGPA MCLA DP EM QMI K-means 1 0.022±0.015 0.113±0.072 0.379±0.020 0.384±0.003 0.395±0.020 0.484±0.019 0.354±0.004 0.466±0.053 0.369±0.008 2 0.023±0.016 0.111±0.054 0.472±0.045 0.502±0.020 0.493±0.004 0.571±0.001 0.387±0.025 0.526±0.050 0.595±0.008 3 0.026±0.016 0.119±0.056 0.392±0.026 0.394±0.021 0.384±0.008 0.596±0.041 0.370±0.022 0.497±0.019 0.442±0.029 4 0.021±0.013 0.095±0.040 0.401±0.013 0.394±0.027 0.381±0.026 0.653±0.042 0.353±0.011 0.580±0.057 0.361±0.006 5 0.026±0.020 0.161±0.118 0.410±0.037 0.468±0.017 0.393±0.009 0.554±0.010 0.358±0.032 0.541±0.035 0.445±0.004 6 0.027±0.017 0.124±0.058 0.346±0.002 0.365±0.010 0.346±0.004 0.805±0.158 0.358±0.004 0.791±0.112 0.462±0.001 7 0.018±0.015 0.108±0.098 0.432±0.026 0.474±0.008 0.427±0.017 0.534±0.068 0.389±0.050 0.482±0.024 0.503±0.004 8 0.022±0.017 0.133±0.099 0.362±0.018 0.394±0.020 0.394±0.008 0.538±0.025 0.357±0.023 0.483±0.049 0.409±0.000 9 0.028±0.018 0.135±0.066 0.401±0.020 0.445±0.039 0.423±0.023 0.511±0.050 0.367±0.017 0.510±0.020 0.441±0.003 10 0.019±0.012 0.088±0.045 0.351±0.014 0.369±0.001 0.361±0.014 0.756±0.059 0.355±0.011 0.662±0.031 0.394±0.001 11 0.035±0.021 0.173±0.045 0.371±0.002 0.401±0.025 0.382±0.024 0.617±0.046 0.347±0.006 0.542±0.029 0.459±0.004 12 0.020±0.012 0.101±0.048 0.368±0.005 0.372±0.018 0.373±0.017 0.629±0.015 0.354±0.007 0.575±0.094 0.417±0.009 13 0.031±0.023 0.173±0.101 0.419±0.014 0.425±0.019 0.400±0.013 0.531±0.027 0.353±0.004 0.511±0.015 0.396±0.000 14 0.020±0.015 0.113±0.089 0.410±0.020 0.412±0.025 0.407±0.006 0.522±0.017 0.357±0.008 0.478±0.028 0.452±0.008 15 0.017±0.013 0.092±0.063 0.392±0.044 0.446±0.032 0.450±0.014 0.576±0.008 0.372±0.005 0.563±0.042 0.491±0.001 16 0.023±0.015 0.119±0.056 0.347±0.005 0.383±0.010 0.369±0.006 0.685±0.069 0.357±0.003 0.627±0.077 0.411±0.001 17 0.018±0.011 0.088±0.025 0.349±0.011 0.352±0.013 0.375±0.003 0.776±0.059 0.354±0.017 0.687±0.095 0.473±0.004 18 0.022±0.014 0.106±0.052 0.388±0.007 0.368±0.020 0.377±0.012 0.587±0.038 0.354±0.008 0.537±0.025 0.404±0.001 19 0.016±0.011 0.090±0.049 0.397±0.022 0.411±0.019 0.402±0.012 0.508±0.012 0.357±0.013 0.481±0.020 0.465±0.002 20 0.021±0.012 0.095±0.032 0.383±0.005 0.385±0.024 0.355±0.011 0.642±0.045 0.380±0.039 0.587±0.051 0.443±0.003 AVG 0.023±0.015 0.117±0.063 0.389±0.018 0.407±0.019 0.394±0.012 0.604±0.040 0.362±0.016 0.556±0.046 0.442±0.005
下载: 导出CSV
表 3 平均纯度值和标准差(每个数据集的最大纯度值加粗显示.)
Table 3 Average purities and standard deviations (The highest purity among different algorithms on each dataset is bolded.)
ID AP-average AP-max CSPA HGPA MCLA DP EM QMI K-means 1 0.315±0.159 0.743±0.251 0.796±0.006 0.796±0.004 0.795±0.004 0.797±0.005 0.803±0.000 0.790±0.009 0.795±0.002 2 0.233±0.127 0.591±0.231 0.704±0.046 0.667±0.011 0.684±0.007 0.769±0.007 0.764±0.007 0.741±0.017 0.633±0.005 3 0.274±0.149 0.707±0.290 0.753±0.009 0.755±0.005 0.755±0.002 0.767±0.001 0.764±0.003 0.754±0.012 0.749±0.013 4 0.252±0.137 0.651±0.244 0.702±0.013 0.706±0.006 0.711±0.008 0.717±0.003 0.719±0.002 0.707±0.003 0.697±0.002 5 0.316±0.170 0.802±0.317 0.863±0.016 0.843±0.007 0.868±0.003 0.878±0.004 0.881±0.004 0.876±0.005 0.840±0.008 6 0.079±0.043 0.202±0.077 0.215±0.001 0.212±0.000 0.215±0.002 0.216±0.002 0.216±0.001 0.216±0.000 0.213±0.000 7 0.270±0.140 0.678±0.240 0.764±0.007 0.761±0.001 0.779±0.005 0.806±0.004 0.801±0.010 0.800±0.007 0.764±0.002 8 0.336±0.179 0.809±0.325 0.861±0.002 0.853±0.005 0.857±0.001 0.868±0.001 0.866±0.002 0.861±0.006 0.842±0.001 9 0.339±0.177 0.775±0.300 0.836±0.023 0.839±0.013 0.825±0.012 0.866±0.002 0.864±0.005 0.849±0.003 0.837±0.003 10 0.239±0.129 0.551±0.223 0.575±0.003 0.578±0.002 0.576±0.000 0.581±0.000 0.580±0.002 0.576±0.002 0.578±0.000 11 0.345±0.177 0.726±0.284 0.769±0.010 0.752±0.003 0.775±0.006 0.782±0.004 0.786±0.001 0.775±0.009 0.752±0.007 12 0.250±0.134 0.658±0.237 0.716±0.003 0.717±0.003 0.718±0.001 0.721±0.003 0.722±0.001 0.718±0.003 0.705±0.004 13 0.325±0.166 0.731±0.274 0.776±0.007 0.777±0.004 0.786±0.003 0.801±0.000 0.800±0.001 0.789±0.014 0.766±0.000 14 0.325±0.166 0.731±0.274 0.776±0.007 0.777±0.004 0.786±0.003 0.801±0.000 0.800±0.001 0.789±0.014 0.877±0.003 15 0.289±0.150 0.713±0.270 0.820±0.027 0.779±0.012 0.784±0.020 0.839±0.001 0.839±0.000 0.818±0.015 0.735±0.002 16 0.265±0.141 0.654±0.265 0.680±0.002 0.674±0.002 0.675±0.002 0.680±0.003 0.681±0.001 0.679±0.002 0.673±0.000 17 0.171±0.090 0.425±0.158 0.465±0.000 0.460±0.006 0.464±0.001 0.471±0.001 0.471±0.001 0.468±0.001 0.459±0.001 18 0.306±0.167 0.784±0.329 0.817±0.006 0.823±0.005 0.817±0.005 0.827±0.002 0.828±0.001 0.824±0.002 0.807±0.002 19 0.316±0.167 0.807±0.316 0.845±0.010 0.844±0.006 0.848±0.005 0.862±0.002 0.863±0.002 0.861±0.000 0.835±0.001 20 0.295±0.156 0.709±0.276 0.750±0.001 0.750±0.007 0.755±0.001 0.759±0.001 0.755±0.003 0.752±0.004 0.752±0.000 AVG 0.277±0.146 0.672±0.259 0.724±0.010 0.718±0.005 0.724±0.005 0.740±0.002 0.740±0.002 0.732±0.006 0.715±0.003
下载: 导出CSV
表 4 实验选择的6种算法的调整后观察值(括号中的调整秩次用于Friedman调整秩和检验的计算.最小代表最好.)
Table 4 Aligned observations of six algorithms selected in the experimental study (The ranks in the parentheses are used in the computation of the Friedman aligned ranks test. The smallest one is the best.)
ID CSPA HGPA MCLA DP EM QMI Total 1 0.000(68) 0.000(60) -0.001(70) 0.001(57) 0.007(26) -0.006(97) 378 2 -0.017(111) -0.054(120) -0.038(119) 0.048(1) 0.042(2) 0.019(7) 360 3 -0.005(93) -0.003(83) -0.002(79) 0.009(21) 0.006(29) -0.004(88) 393 4 -0.009(104) -0.004(91) 0.001(55) 0.007(28) 0.009(19) -0.003(84) 381 5 -0.005(94) -0.025(116) 0.000(65) 0.01(17) 0.013(11) 0.007(23) 326 6 0.000(63) -0.003(80) 0.000(61) 0.001(56) 0.001(52) 0.000(58) 370 7 -0.021(112) -0.025(115) -0.007(99) 0.021(5) 0.016(9) 0.015(10) 350 8 0.000(67) -0.008(102) -0.004(90) 0.007(24) 0.005(32) 0.000(62) 377 9 -0.010(106) -0.008(101) -0.022(114) 0.019(6) 0.018(8) 0.003(40) 375 10 -0.003(82) 0.000(59) -0.002(74) 0.004(37) 0.002(41) -0.001(71) 364 11 -0.004(92) -0.021(113) 0.002(42) 0.009(18) 0.013(12) 0.002(43) 320 12 -0.003(81) -0.001(73) 0.000(66) 0.002(44) 0.003(38) -0.001(69) 371 13 -0.012(109.5) -0.011(107.5) -0.002(77.5) 0.013(13.5) 0.012(15.5) 0.001(53.5) 377 14 -0.012(109.5) -0.011(107.5) -0.002(77.5) 0.013(13.5) 0.012(15.5) 0.001(53.5) 377 15 0.007(27) -0.034(118) -0.029(117) 0.026(4) 0.026(3) 0.005(33) 302 16 0.001(49) -0.004(89) -0.003(87) 0.002(45) 0.003(39) 0.001(50) 359 17 -0.001(72) -0.007(100) -0.002(76) 0.004(35) 0.004(36) 0.001(48) 367 18 -0.006(96) 0.000(64) -0.006(95) 0.004(34) 0.005(31) 0.002(47) 367 19 -0.008(103) -0.010(105) -0.006(98) 0.008(22) 0.009(20) 0.007(25) 373 20 -0.003(86) -0.003(85) 0.001(51) 0.006(30) 0.002(46) -0.002(75) 373 Total 1725 1889 1613 511 485 1037 AVG 86.25 94.45 80.65 25.55 24.25 51.85
下载: 导出CSV
-
[1] Jain A K, Murty M N, Flynn P J. Data clustering: a review. ACM Computing Surveys (CSUR), 1999, 31(3): 264-323 doi: 10.1145/331499.331504 [2] 周晨曦, 梁循, 齐金山.基于约束动态更新的半监督层次聚类算法.自动化学报, 2015, 41(7): 1253-1263 http://www.aas.net.cn/CN/abstract/abstract18699.shtmlZhou Chen-Xi, Liang Xun, Qi Jin-Shan. A semi-supervised agglomerative hierarchical clustering method based on dynamically updating constraints. Acta Automatica Sinica, 2015, 41(7): 1253-1263 http://www.aas.net.cn/CN/abstract/abstract18699.shtml [3] 陈, 何辉豪.基于密度的聚类中心自动确定的混合属性数据聚类算法研究.自动化学报, 2015, 41(10): 1798-1813 http://www.aas.net.cn/CN/abstract/abstract18754.shtmlChen Jin-Yin, He Hui-Hao. Research on density-based clustering algorithm for mixed data with determine cluster centers automatically. Acta Automatica Sinica, 2015, 41(10): 1798-1813 http://www.aas.net.cn/CN/abstract/abstract18754.shtml [4] 王卫卫, 李小平, 冯象初, 王斯琪.稀疏子空间聚类综述.自动化学报, 2015, 41(8): 1373-1384 http://www.aas.net.cn/CN/abstract/abstract18712.shtmlWang Wei-Wei, Li Xiao-Ping, Feng Xiang-Chu, Wang Si-Qi. A survey on sparse subspace clustering. Acta Automatica Sinica, 2015, 41(8): 1373-1384 http://www.aas.net.cn/CN/abstract/abstract18712.shtml [5] Taşdemir K, Moazzen Y, Yildirim I. An approximate spectral clustering ensemble for high spatial resolution remote-sensing images. IEEE Journal of Selected Topics in Applied Earth Observations and Remote Sensing, 2015, 8(5): 1996-2004 doi: 10.1109/JSTARS.2015.2424292 [6] Parvin H, Minaei-Bidgoli B. A clustering ensemble framework based on selection of fuzzy weighted clusters in a locally adaptive clustering algorithm. Pattern Analysis and Applications, 2015, 18(1): 87-112 doi: 10.1007/s10044-013-0364-4 [7] Strehl A, Ghosh J. Cluster ensembles——a knowledge reuse framework for combining multiple partitions. The Journal of Machine Learning Research, 2002, 3: 583-617 [8] Gionis A, Mannila H, Tsaparas P. Clustering aggregation. ACM Transactions on Knowledge Discovery from Data (TKDD), 2007, 1(1): Article No. 4 doi: 10.1145/1217299 [9] Topchy A, Jain A K, Punch W. Clustering ensembles: models of consensus and weak partitions. IEEE Transactions on Pattern Analysis and Machine Intelligence, 2005, 27(12): 1866-1881 doi: 10.1109/TPAMI.2005.237 [10] Bhattacharjee A, Richards W G, Staunton J, Li C, Monti S, Vasa P, Ladd C, Beheshti J, Bueno R, Gillette M, Loda M, Weber G, Mark E J, Lander E S, Wong W, Johnson B E, Golub T R, Sugarbaker D J, Meyerson M. Classification of human lung carcinomas by mRNA expression profiling reveals distinct adenocarcinoma subclasses. Proceedings of the National Academy of Sciences of the United States of America, 2001, 98(24): 13790-13795 doi: 10.1073/pnas.191502998 [11] Lindblad-Toh K, Tanenbaum D M, Daly M J, Winchester E, Lui W O, Villapakkam A, Stanton S E, Larsson C, Hudson T J, Johnson B E, Lander E S, Meyerson M. Loss-of-heterozygosity analysis of small-cell lung carcinomas using single-nucleotide polymorphism arrays. Nature Biotechnology, 2000, 18(9): 1001-1005 doi: 10.1038/79269 [12] Rodriguez A, Laio A. Clustering by fast search and find of density peaks. Science, 2014, 344(6191): 1492-1496 doi: 10.1126/science.1242072 [13] Reshef D N, Reshef Y A, Finucane H K, Grossman S R, McVean G, Turnbaugh P J, Lander E S, Mitzenmacher M, Sabeti P C. Detecting novel associations in large data sets. Science, 2011, 334(6062): 1518-1524 doi: 10.1126/science.1205438 [14] Tang D M, Wang M W, Zheng W F, Wang H J. RapidMic: rapid computation of the maximal information coefficient. Evolutionary Bioinformatics Online, 2014, 10: 11-16 http://cn.bing.com/academic/profile?id=2004127671&encoded=0&v=paper_preview&mkt=zh-cn [15] 唐伟, 周志华.基于Bagging的选择性聚类集成.软件学报, 2005, 16(4): 496-502 doi: 10.1360/jos160496Tang Wei, Zhou Zhi-Hua. Bagging-based selective clusterer ensemble. Journal of Software, 2005, 16(4): 496-502 doi: 10.1360/jos160496 [16] Fred A L N, Jain A K. Combining multiple clusterings using evidence accumulation. IEEE Transactions on Pattern Analysis and Machine Intelligence, 2005, 27(6): 835-850 doi: 10.1109/TPAMI.2005.113 [17] Topchy A, Jain A K, Punch W. A mixture model for clustering ensembles. In: Proceedings of the 2004 SIAM International Conference on Data Mining. Florida, USA: SIAM, 2004. [18] Ayad H G, Kamel M S. On voting-based consensus of cluster ensembles. Pattern Recognition, 2010, 43(5): 1943-1953 doi: 10.1016/j.patcog.2009.11.012 [19] Zheng L, Li T, Ding C. Hierarchical ensemble clustering. In: Proceedings of the 10th IEEE International Conference on Data Mining (ICDM). Sydney, NSW: IEEE, 2010. 1199-1204 [20] Wang H J, Shan H H, Banerjee A. Bayesian cluster ensembles. Statistical Analysis and Data Mining, 2011, 4(1): 54-70 doi: 10.1002/sam.v4.1 [21] 周林, 平西建, 徐森, 张涛.基于谱聚类的聚类集成算法.自动化学报, 2012, 38(8): 1335-1342 doi: 10.3724/SP.J.1004.2012.01335Zhou Lin, Ping Xi-Jian, Xu Sen, Zhang Tao. Cluster ensemble based on spectral clustering. Acta Automatica Sinica, 2012, 38(8): 1335-1342 doi: 10.3724/SP.J.1004.2012.01335 [22] Banerjee B, Bovolo F, Bhattacharya A, Bruzzone L, Chaudhuri S, Mohan B K. A new self-training-based unsupervised satellite image classification technique using cluster ensemble strategy. IEEE Geoscience and Remote Sensing Letters, 2015, 12(4): 741-745 doi: 10.1109/LGRS.2014.2360833 [23] Lingras P, Haider F. Partially ordered rough ensemble clustering for multigranular representations. Intelligent Data Analysis, 2015, 19(s1): S103-S116 doi: 10.3233/IDA-150772 [24] Wahid A, Gao X Y, Andreae P. Multi-objective clustering ensemble for high-dimensional data based on strength pareto evolutionary algorithm (SPEA-II). In: Proceedings of the 2015 IEEE International Conference on Data Science and Advanced Analytics (DSAA). Paris: IEEE, 2015. 1-9 [25] Goswami J P, Mahanta A K. A genetic algorithm based ensemble approach for categorical data clustering. In: Proceedings of the 2015 Annual IEEE India Conference (INDICON). New Delhi, India: IEEE, 2015. 1-6 [26] Wei S T, Li Z X, Zhang C L. A semi-supervised clustering ensemble approach integrated constraint-based and metric-based. In: Proceedings of the 7th International Conference on Internet Multimedia Computing and Service. New York, USA: ACM, 2015. Article No. 26 [27] Liu L M, Liao Z F, Liao Z N. An efficient clustering ensemble selection algorithm. International Journal of Autonomous and Adaptive Communications Systems, 2015, 8(2-3): 200-212 http://cn.bing.com/academic/profile?id=1902036342&encoded=0&v=paper_preview&mkt=zh-cn [28] Hao Z F, Wang L J, Cai R C, Wen W. An improved clustering ensemble method based link analysis. World Wide Web, 2015, 18(2): 185-195 doi: 10.1007/s11280-013-0208-6 [29] Huang D, Lai J H, Wang C D. Ensemble clustering using factor graph. Pattern Recognition, 2016, 50: 131-142 doi: 10.1016/j.patcog.2015.08.015 [30] Kuncheva L I, Whitaker C J. Measures of diversity in classifier ensembles and their relationship with the ensemble accuracy. Machine learning, 2003, 51(2): 181-207 doi: 10.1023/A:1022859003006 [31] Kuncheva L I, Hadjitodorov S T. Using diversity in cluster ensembles. In: Proceedings of the 2004 IEEE International Conference on Systems, Man and Cybernetics. The Hague: IEEE, 2004. 1214-1219 [32] Topchy A P, Law M H C, Jain A K, Fred A L. Analysis of consensus partition in cluster ensemble. In: Proceedings of the 4th IEEE International Conference on Data Mining. Brighton, UK: IEEE, 2004. 225-232 [33] Amasyali M F, Ersoy O. The performance factors of clustering ensembles. In: Proceedings of the 16th IEEE Communication and Applications Conference on Signal Processing. Aydin: IEEE, 2008. 1-4 [34] Zhang S H, Wong H S. ARImp: a generalized adjusted rand index for cluster ensembles. In: Proceedings of the 20th International Conference on Pattern Recognition (ICPR). Istanbul: IEEE, 2010. 778-781 [35] Wang T. CA-Tree: a hierarchical structure for efficient and scalable coassociation-based cluster ensembles. IEEE Transactions on Systems, Man, and Cybernetics, Part B: Cybernetics, 2011, 41(3): 686-698 doi: 10.1109/TSMCB.2010.2086059 [36] 文献全部内容项Zhou P, Du L, Wang H M, Shi L, Shen Y D. Learning a robust consensus matrix for clustering ensemble via Kullback-Leibler divergence minimization. In: Proceedings of the 24th International Conference on Artificial Intelligence. Washington, USA: AAAI, 2015. 4112-4118 [37] Zhong C M, Yue X D, Zhang Z H, Lei J S. A clustering ensemble: two-level-refined co-association matrix with path-based transformation. Pattern Recognition, 2015, 48(8): 2699-2709 doi: 10.1016/j.patcog.2015.02.014 [38] Wahid A, Gao X Y, Andreae P. Multi-objective multi-view clustering ensemble based on evolutionary approach. In: Proceedings of the 2015 IEEE Congress on Evolutionary Computation (CEC). Sendai, Japan: IEEE, 2015. 1696-1703 [39] Yu Z W, Wong H S. Class discovery from gene expression data based on perturbation and cluster ensemble. IEEE Transactions on NanoBioscience, 2009, 8(2): 147-160 doi: 10.1109/TNB.2009.2023321 [40] Zhang X R, Jiao L C, Liu F, Bo L F, Gong M G. Spectral clustering ensemble applied to SAR image segmentation. IEEE Transactions on Geoscience and Remote Sensing, 2008, 46(7): 2126-2136 doi: 10.1109/TGRS.2008.918647 [41] Hu X H, Park E K, Zhang X D. Microarray gene cluster identification and annotation through cluster ensemble and EM-based informative textual summarization. IEEE Transactions on Information Technology in Biomedicine, 2009, 13(5): 832-840 doi: 10.1109/TITB.2009.2023984 [42] 徐森, 卢志茂, 顾国昌.解决文本聚类集成问题的两个谱算法.自动化学报, 2009, 35(7): 997-1002 doi: 10.3724/SP.J.1004.2009.00997Xu Sen, Lu Zhi-Mao, Gu Guo-Chang. Two spectral algorithms for ensembling document clusters. Acta Automatica Sinica, 2009, 35(7): 997-1002 doi: 10.3724/SP.J.1004.2009.00997 [43] Ye Y F, Li T, Chen Y, Jiang Q S. Automatic malware categorization using cluster ensemble. In: Proceedings of the 16th ACM SIGKDD International Conference on Knowledge Discovery and Data Mining. New York, USA: ACM, 2010. 95-104 [44] Zhang P, Zhu X Q, Tan J L, Guo L. Classifier and cluster ensembles for mining concept drifting data streams. In: Proceedings of the 2010 IEEE International Conference on Data Mining (ICDM). Sydney, NSW: IEEE, 2010. 1175-1180 [45] Yu Z W, Deng Z K, Wong H S, Tan L R. Identifying protein-kinase-specific phosphorylation sites based on the bagging——AdaBoost ensemble approach. IEEE Transactions on NanoBioscience, 2010, 9(2): 132-143 doi: 10.1109/TNB.2010.2043682 [46] Yu Z W, Li L, You J, Wong H S, Han G Q. SC3: triple spectral clustering-based consensus clustering framework for class discovery from cancer gene expression profiles. IEEE/ACM Transactions on Computational Biology and Bioinformatics, 2012, 9(6): 1751-1765 doi: 10.1109/TCBB.2012.108 [47] Ammour N, Alajlan N. A dynamic weights OWA fusion for ensemble clustering. Signal, Image and Video Processing, 2015, 9(3): 727-734 doi: 10.1007/s11760-013-0499-1 [48] Li F Y, Wu K, Lei J S, Wen M, Bi Z Q, Gu C H. Steganalysis over large-scale social networks with high-order joint features and clustering ensembles. IEEE Transactions on Information Forensics and Security, 2016, 11(2): 344-357 doi: 10.1109/TIFS.2015.2496910 [49] Xiao W C, Yang Y, Wang H J, Li T R, Xing H L. Semi-supervised hierarchical clustering ensemble and its application. Neurocomputing, 2016, 173: 1362-1376 doi: 10.1016/j.neucom.2015.09.009 [50] Teng G, He C Z, Xiao J, He Y, Zhu B, Jiang X Y. Cluster ensemble framework based on the group method of data handling. Applied Soft Computing, 2016, 43: 35-46 doi: 10.1016/j.asoc.2016.01.043 [51] Frey B J, Dueck D. Clustering by passing messages between data points. Science, 2007, 315(5814): 972-976 doi: 10.1126/science.1136800 [52] Tenenbaum J B, de Silva V, Langford J C. A global geometric framework for nonlinear dimensionality reduction. Science, 2000, 290(5500): 2319-2323 doi: 10.1126/science.290.5500.2319 [53] Zhou Z H, Tang W. Clusterer ensemble. Knowledge-Based Systems, 2006, 19(1): 77-83 doi: 10.1016/j.knosys.2005.11.003 [54] Modha D S, Spangler W S. Feature weighting in K-means clustering. Machine Learning, 2003, 52(3): 217-237 doi: 10.1023/A:1024016609528 [55] Yang Z R, Oja E. Linear and nonlinear projective nonnegative matrix factorization. IEEE Transactions on Neural Networks, 2010, 21(5): 734-749 doi: 10.1109/TNN.2010.2041361 [56] García S, Fernández A, Luengo J, Herrera F. Advanced nonparametric tests for multiple comparisons in the design of experiments in computational intelligence and data mining: experimental analysis of power. Information Sciences, 2010, 180(10): 2044-2064 doi: 10.1016/j.ins.2009.12.010 -

 下载:
下载:

计量
- 文章访问数: 3540
- HTML全文浏览量: 634
- PDF下载量: 1459
- 被引次数: 0
