

Koopman Feature Kernel-based Time-frequency Causal and Delay Inference Network for Industrial Systems
-
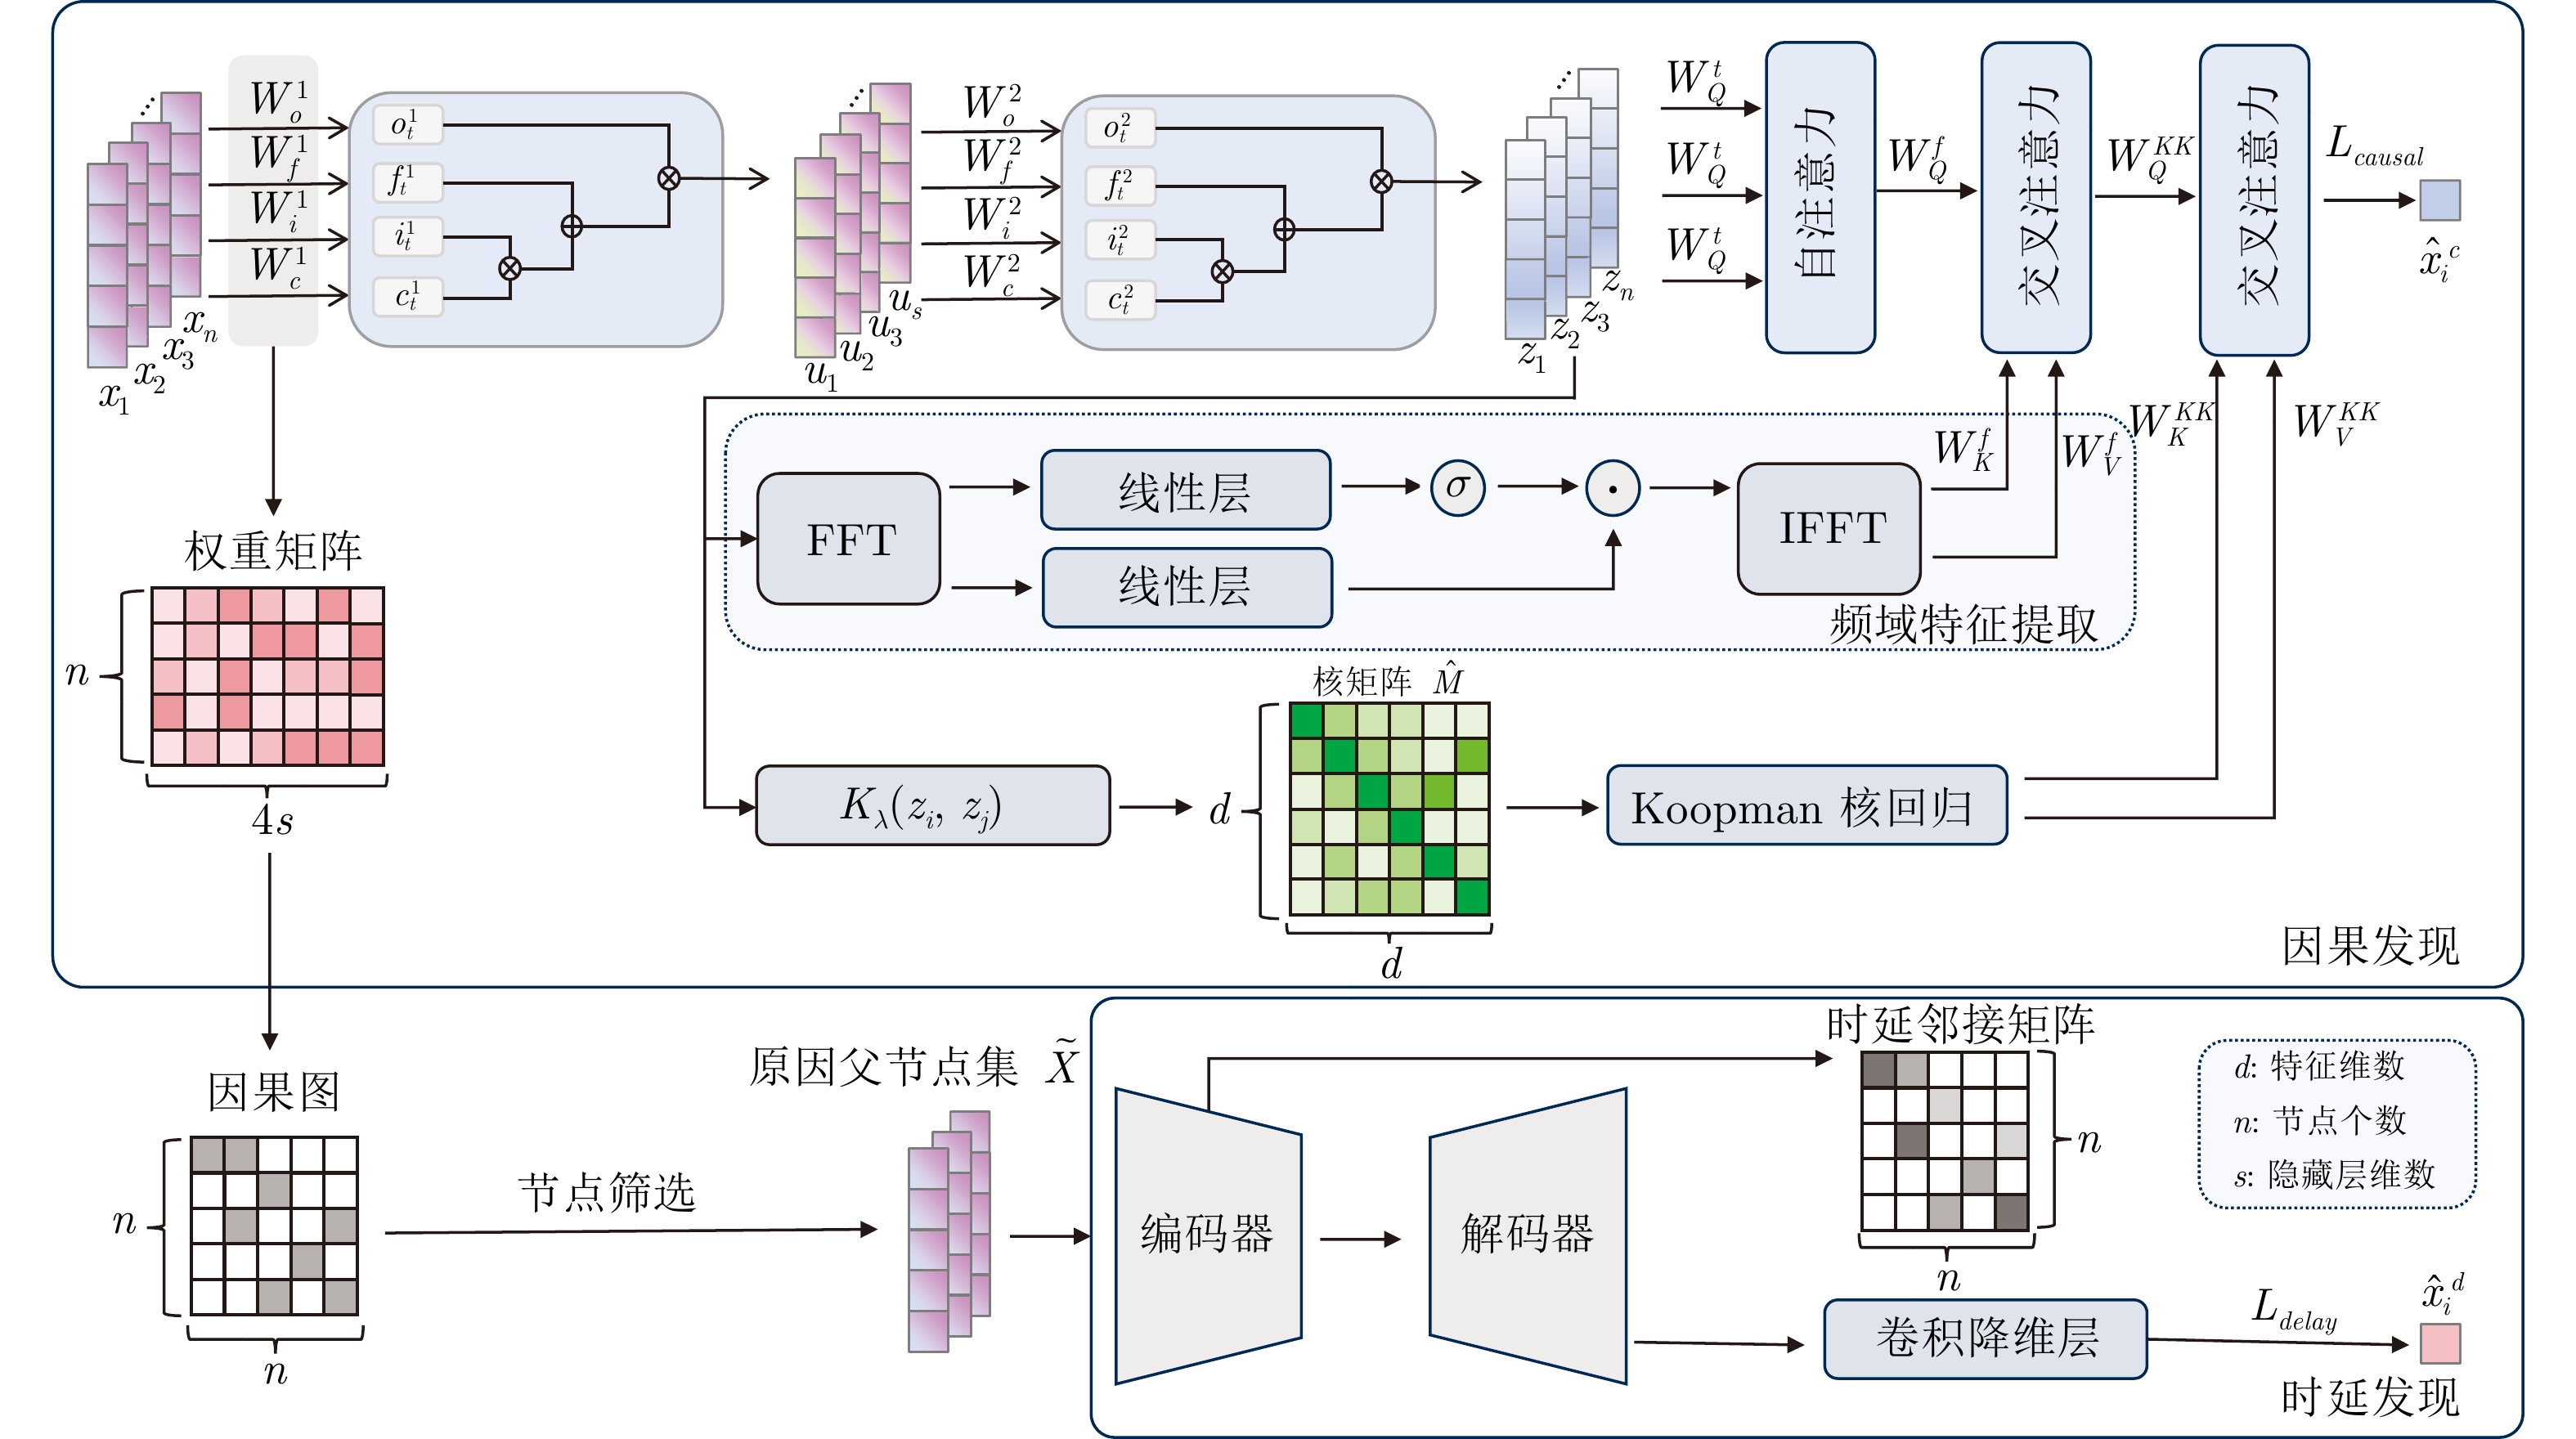
摘要: 因果推理在复杂工业系统中对产能分析和产出优化具有重要意义. 然而, 现有方法难以有效处理这种高度非线性和时延的复杂因果关系. 为此提出了一种基于Koopman特征核的时频因果与时延推理网络(Koopman feature kernel-based time-frequency causal and delay inference network, KTFCDN), 用于复杂工业过程的因果分析与时延识别. 该方法结合Koopman特征变换与再生核理论设计了核回归层, 在保留时间信息的基础上, 将数据映射到高维再生核希尔伯特空间以提取时不变的非线性关系. 同时, 通过证明非线性格兰杰因果关系在时频域上的一致性, 进而在时域上融入频域特征以提取时间维度的全局信息并捕获变量间的时延关系. 此外, 针对长时延问题, 设计了基于状态空间模型的时延发现网络. 实验结果表明, 该方法在三个公共数据集上表现优异, 并在聚酯纤维酯化过程的实际应用中进一步验证了其有效性.Abstract: Causal inference plays a crucial role in capacity analysis and output optimization in complex industrial systems. However, existing methods struggle to effectively address highly nonlinear and time-delayed complex causal relationships. To address this, a Koopman feature kernel-based time-frequency causal and delay inference network (KTFCDN) is proposed for causal analysis and delay identification in complex industrial processes. This method combines Koopman feature transformation and reproducing kernel theory to design a kernel regression layer. By preserving temporal information, it maps data into a high-dimensional reproducing kernel Hilbert space to extract time-invariant nonlinear relationships. Meanwhile, by proving the consistency of nonlinear Granger causality in both time and frequency domains, the method integrates frequency-domain features to extract global temporal information and capture time-delay relationships between variables. Furthermore, a time-delay discovery network based on a state-space model is designed to address the challenge of long time delays. Experimental results demonstrate that this method achieves outstanding performance on three public datasets and is further validated for practical applications in the polyester fiber esterification process.
-
Key words:
- Causal inference /
- industial system /
- recovery kernel hilbert space /
- state space model
-
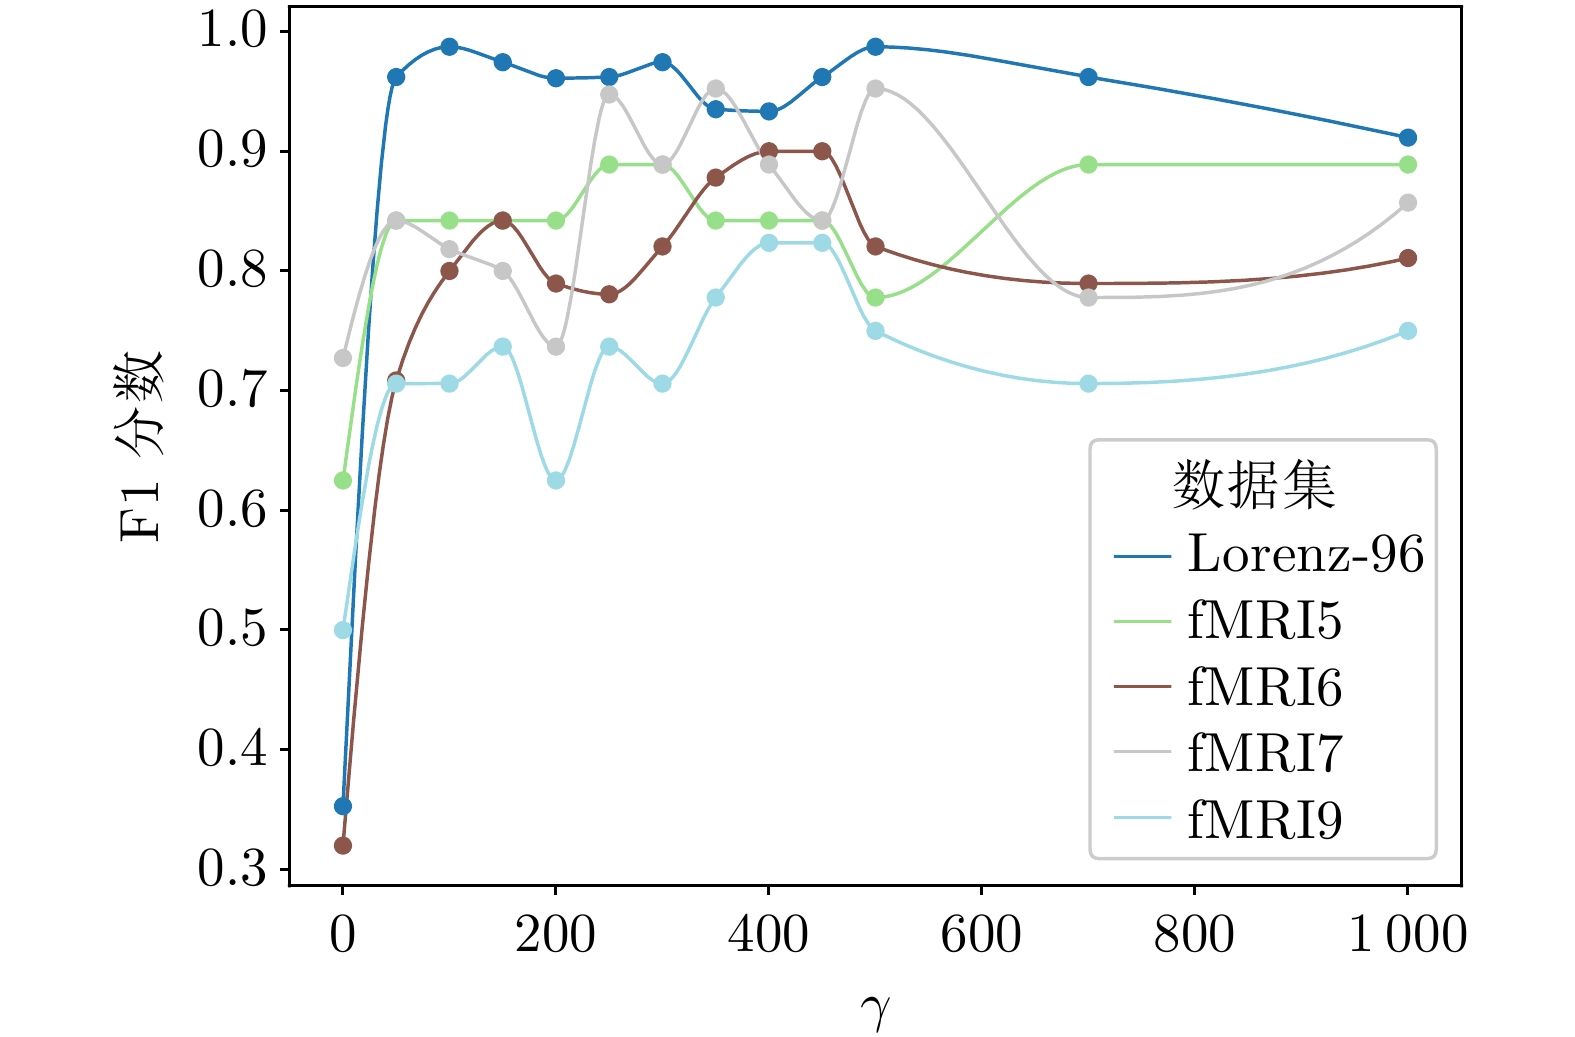
图 2 不同的$ \gamma $值对应的各数据集因果发现F1分数
Fig. 2 F1 scores of causal discovery for different datasets corresponding to different values of $ \gamma $
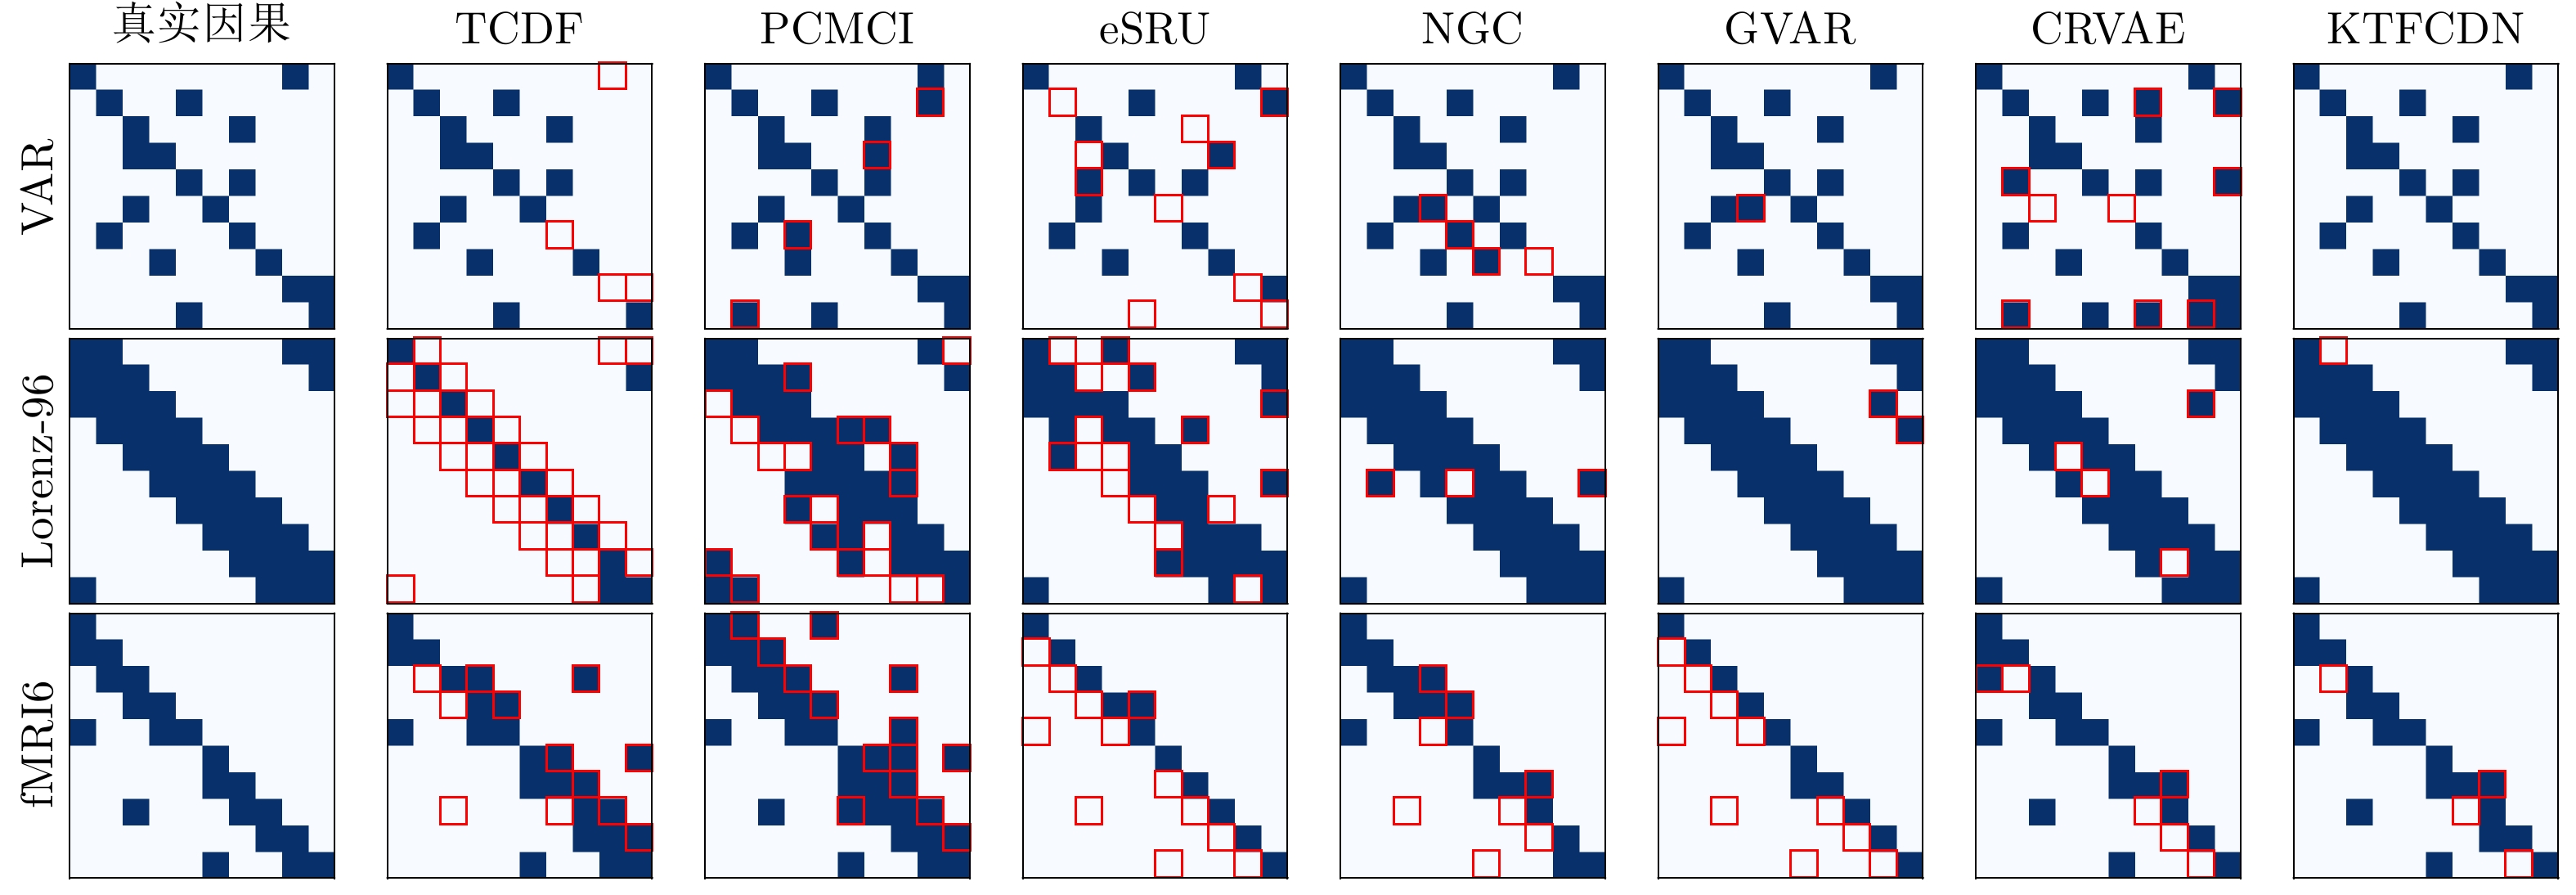
图 3 因果邻接矩阵. 第一列提供了真实因果的可视化, 其他的提供了由因果发现方法 发现的因果图. 错误的因果关系用红色的方框标注.
Fig. 3 Causal adjacency matrices. The first column provides a visualization of the ground truth causal relationships, while the others present the causal graphs discovered by causal discovery methods. Incorrect causal relationships are highlighted with red boxes.
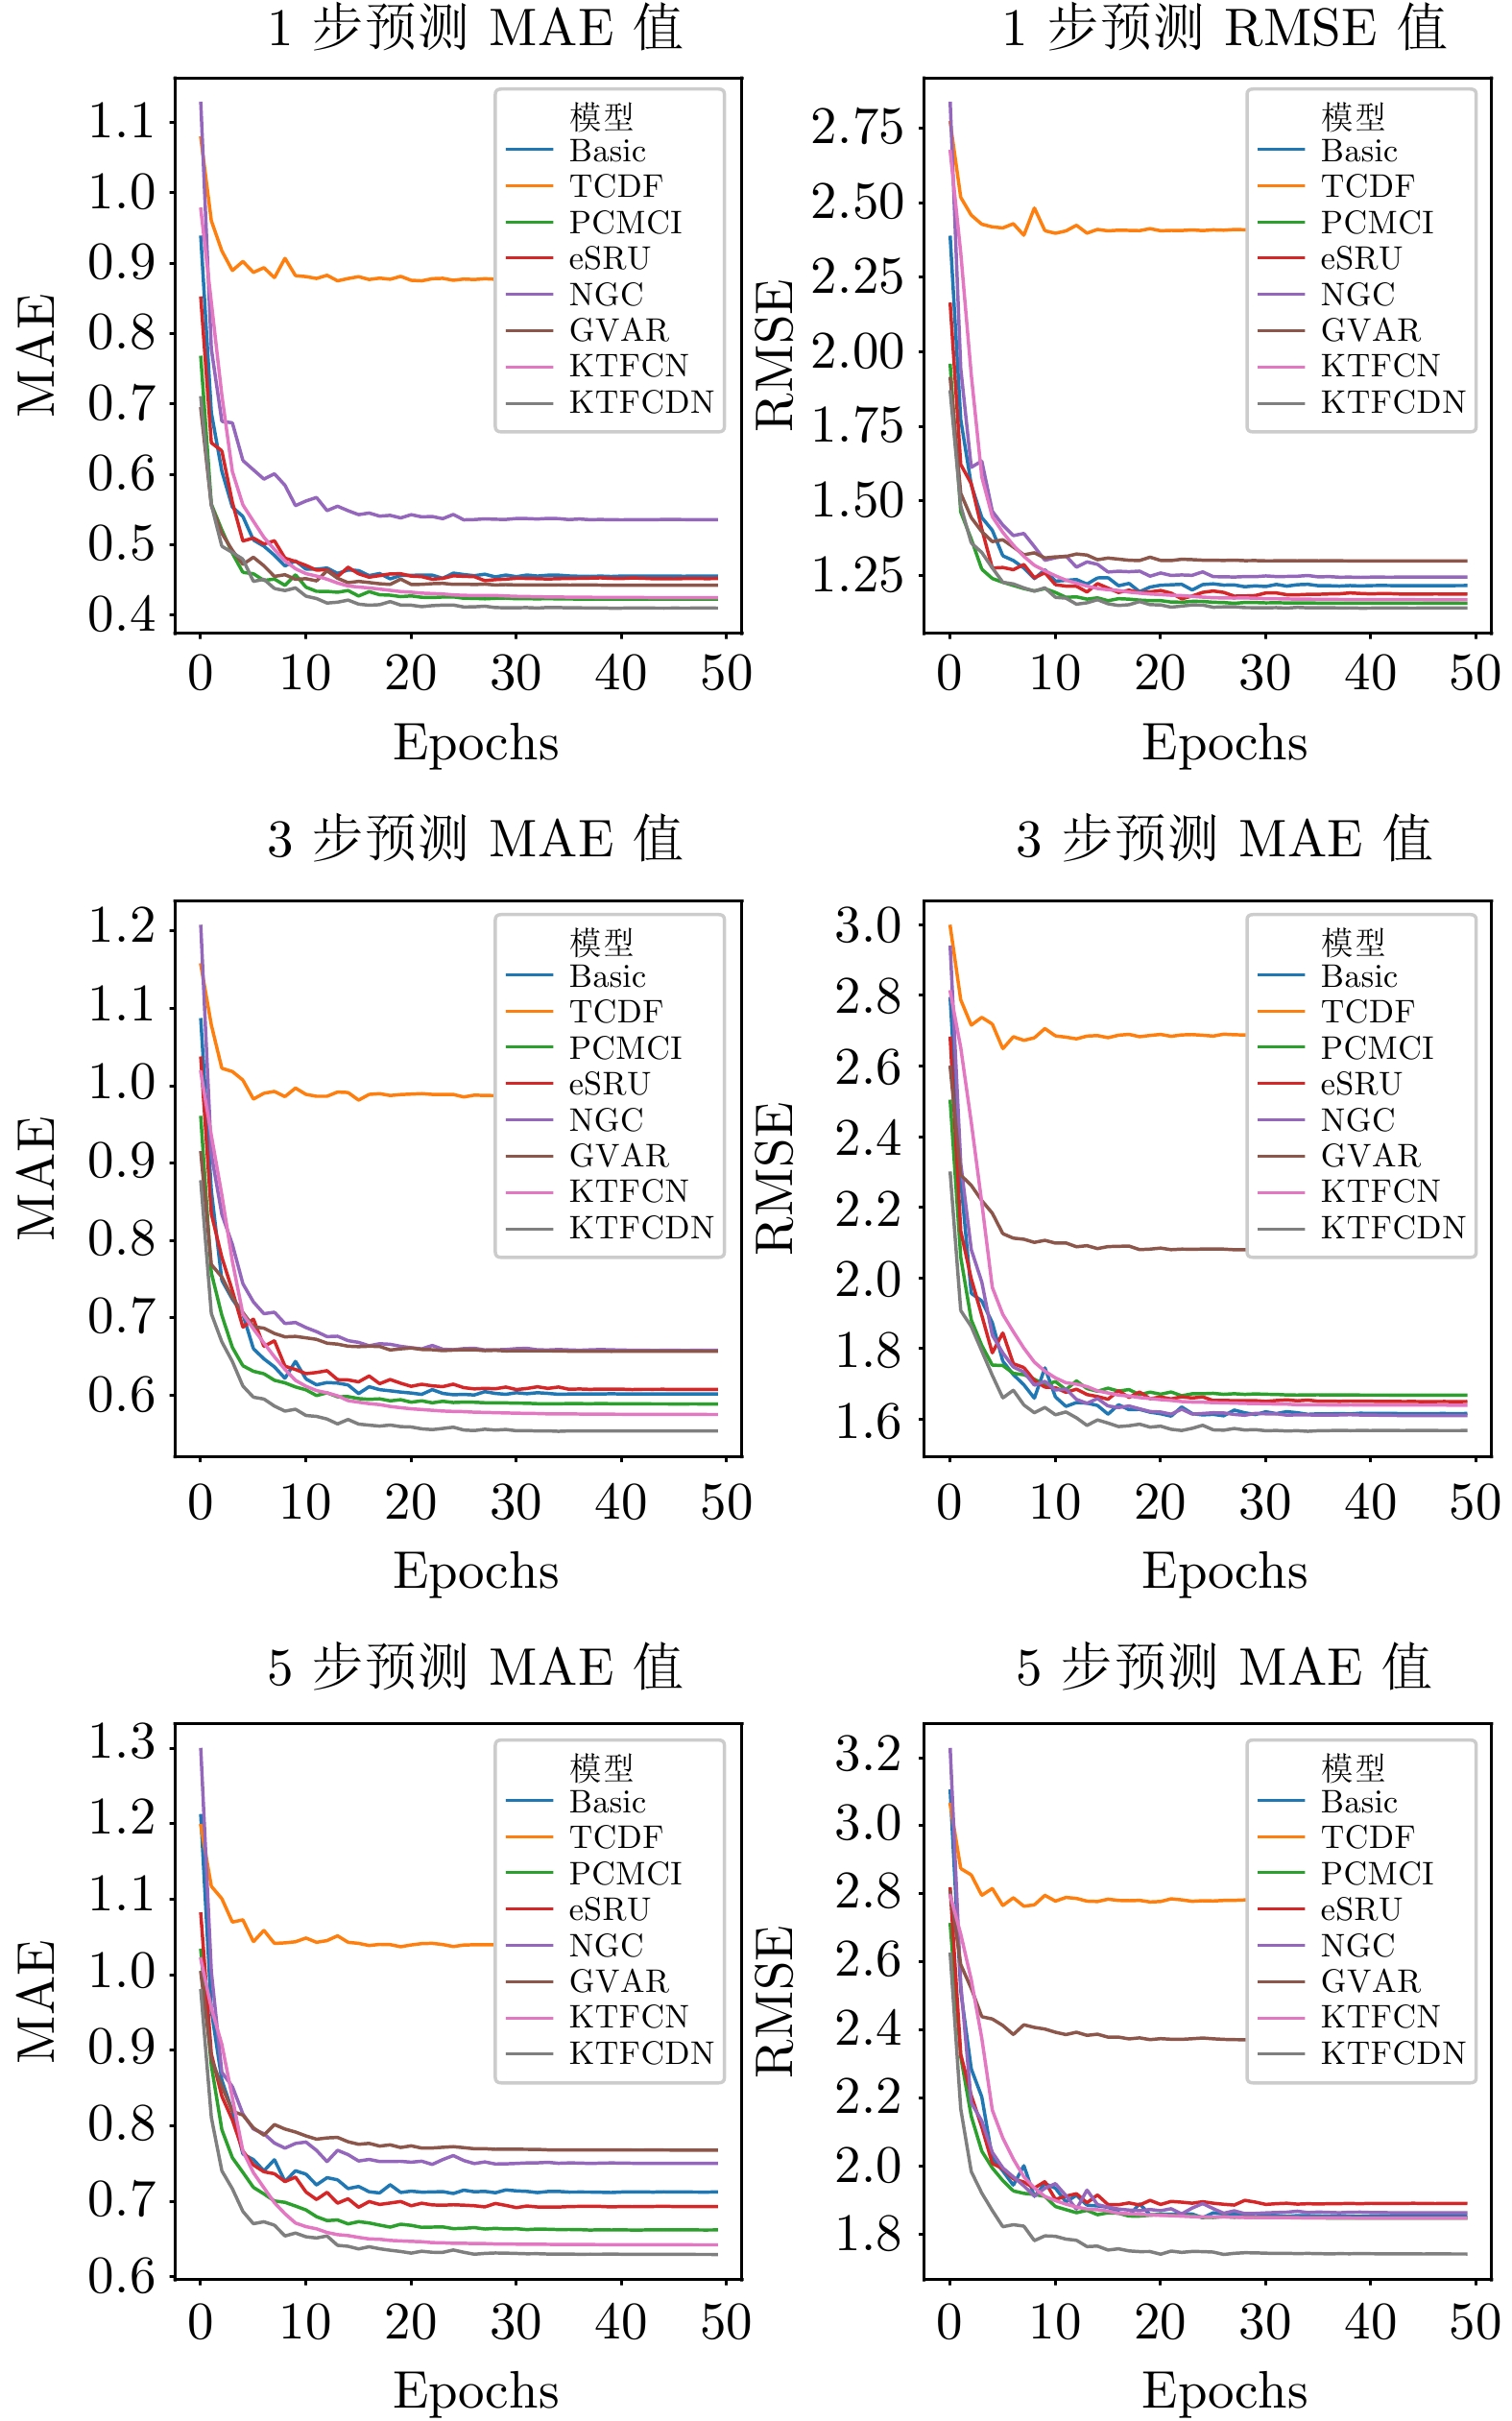
图 5 比较不同预测步数预测指标收敛情况
Fig. 5 Comparison of convergence of prediction metrics with different prediction steps
表 1 因果发现比较实验
Table 1 Causal discovery comparison experiment
模型 VAR Lorenz-96 fMRI5 fMRI6 fMRI7 fMRI9 acc F1 acc F1 acc F1 acc F1 acc F1 acc F1 TCDF 96 0.8235 72 0.4528 76 0.6250 86 0.6667 68 0.5000 56 0.4211 PCMCI 96 0.9091 81 0.6250 60 0.6667 82 0.7000 80 0.8000 56 0.6452 eSRU 90 0.7222 83 0.7792 72 0.6316 88 0.6250 68 0.5556 68 0.6363 NGC 98 0.9523 97 0.9630 84 0.7500 92 0.8000 84 0.7500 68 0.5000 GVAR 99 0.9756 98 0.9756 76 0.7692 90 0.6875 88 0.8235 80 0.8059 CRVAE 91 0.8000 96 0.9478 80 0.7619 94 0.8500 80 0.7619 72 0.6923 KTFCDN 100 1.0000 99 0.9873 92 0.8889 96 0.9000 96 0.9524 88 0.8235  下载: 导出CSV
表 2 时延发现比较实验
Table 2 Time delay discovery comparison experiment
模型 VAR-10 VAR-50 VAR-70 VAR-100 fMRI5 fMRI6 fMRI7 fMRI9 TCDF 1.000 0.9861 0.9327 0.8894 0.8609 0.8805 0.8925 0.9063 PCMCI 1.000 0.9856 0.9830 0.9466 0.8795 0.8962 0.9063 0.9160 NGC 1.000 0.9855 0.9760 0.9020 0.8610 0.8689 0.8570 0.9310 KTFCDN 1.000 1.000 1.000 1.000 0.8972 0.9439 0.9695 0.9975
下载: 导出CSV
表 3 KTFCDN消融研究结果
Table 3 Ablation study results of KTFCDN
模型 VAR Lorenz-96 fMRI5 fMRI6 fMRI7 fMRI9 acc F1 acc F1 acc F1 acc F1 acc F1 acc F1 cLSTM 98 0.95 97 0.96 84 0.75 92 0.80 84 0.75 68 0.50 TFCDN 100 1.00 98 0.95 84 0.75 94 0.84 88 0.82 80 0.71 KCDN 100 1.00 94 0.93 88 0.84 94 0.86 92 0.89 84 0.75 KTFCDN 100 1.00 99 0.99 92 0.89 96 0.90 96 0.95 88 0.82
下载: 导出CSV
表 4 KTFCDN运行效率分析
Table 4 Computational efficiency analysis of KTFCDN
节点数量 时间窗
口长度参数量(M) FLOPs(MMac) 每epoch训练
时间(s)5 10 0.26 2.49 2.37 5 50 0.83 14.85 7.09 5 100 2.54 35.72 9.21 10 10 0.59 5.82 12.26 10 50 1.63 39.23 38.34 10 100 4.77 103.23 93.73 15 10 0.91 9.36 29.66 15 50 2.34 67.26 114.68 15 100 6.62 185.99 280.53
下载: 导出CSV
表 5 聚酯纤维酯化数据集预测实验结果
Table 5 Prediction results on the polyester fiber esterification dataset
模型 单步预测 三步预测 五步预测 MAE RMSE MAE RMSE MAE RMSE Base 0.4557 1.2153 0.6016 1.6172 0.7118 1.8534 TCDF 0.8770 2.4114 0.9875 2.6900 1.0401 2.7822 PCMCI 0.4230 1.1564 0.5887 1.6691 0.6623 1.8487 eSRU 0.4520 1.1873 0.6075 1.6512 0.6932 1.8914 GVAR 0.4429 1.2987 0.6568 2.0803 0.7680 2.3720 NGC 0.5360 1.2447 0.6580 1.6117 0.7503 1.8641 KTFCN 0.4250 1.1681 0.5751 1.6408 0.6425 1.8496 KTFCDN 0.4103 1.1403 0.5538 1.5691 0.6298 1.7433
下载: 导出CSV
-
[1] 赵健程, 赵春晖. 面向全量测点耦合结构分析与估计的工业过程监测方法. 自动化学报, 2024, 50(8): 1517−1538Zhao Jian-Cheng, Zhao Chun-Hui. An industrial process monitoring method based on total measurement point coupling structure analysis and estimation. Acta Automatica Sinica, 2024, 50(8): 1517−1538 [2] 刘雨蒙, 郑旭, 田玲, 王宏安. 基于时序图推理的设备剩余使用寿命预测. 自动化学报, 2024, 50(1): 76−88Liu Yu-Meng, Zheng Xu, Tian Ling, Wang Hong-An. Remaining useful life estimation of facilities based on reasoning over temporal graphs. Acta Automatica Sinica, 2024, 50(1): 76−88 [3] 唐鹏, 彭开香, 董洁. 一种新颖的深度因果图建模及其故障诊断方法. 自动化学报, 2022, 48(6): 1616−1624Tang Peng, Peng Kai-Xiang, Dong Jie. A novel method for deep causality graph modeling and fault diagnosis. Acta Automatica Sinica, 2022, 48(6): 1616−1624 [4] 谭帅, 王一帆, 姜庆超, 侍洪波, 宋冰. 基于不同故障传播路径差异化的故障诊断方法. 自动化学报, 20241−13Tan Shuai, Wang Yi-Fan, Jiang Qing-Chao, Shi Hong-Bo, Song Bing. Fault propagation path-aware network: A fault diagnosis method. Acta Automatica Sinica, 20241−13 [5] 任伟杰, 韩敏. 多元时间序列因果关系分析研究综述. 自动化学报, 2021, 47(1): 64−78Ren Wei-Jie, Han Min. Survey on causality analysis of multivariate time series. Acta Automatica Sinica, 2021, 47(1): 64−78 [6] 孙悦雯, 柳文章, 孙长银. 基于因果建模的强化学习控制: 现状及展望. 自动化学报, 2023, 49(3): 661−677Sun Yue-Wen, Liu Wen-Zhang, Sun Chang-Yin. Causality in reinforcement learning control: The state of the art and prospects. Acta Automatica Sinica, 2023, 49(3): 661−677 [7] Spirtes P, Glymour C. An algorithm for fast recovery of sparse causal graphs. Social Science Computer Review, 1991, 9(1): 62−72 doi: 10.1177/089443939100900106 [8] Malinsky D, Spirtes P. Causal structure learning from multivariate time series in settings with unmeasured confounding. In: Proceedings of 2018 ACM SIGKDD Workshop on Causal Discovery. PMLR, 2018. 23–47. [9] Runge J, Nowack P, Kretschmer M, Flaxman S, Sejdinovic D. Detecting and quantifying causal associations in large nonlinear time series datasets. Science Advances, 2019, 5(11): eaau4996 doi: 10.1126/sciadv.aau4996 [10] Runge J. Discovering contemporaneous and lagged causal relations in autocorrelated nonlinear time series datasets. In: Peters J, Sontag D, editors. Proceedings of the 36th Conference on Uncertainty in Artificial Intelligence (UAI). Proceedings of Machine Learning Research, vol. 124. PMLR, 2020. 1388–1397. [11] Assaad C K, Devijver E, Gaussier E. Discovery of extended summary graphs in time series. In: Uncertainty in Artificial Intelligence. PMLR, 2022. 96–106. [12] Shimizu S, Hoyer P O, Hyvärinen A, Kerminen A. A linear non-Gaussian acyclic model for causal discovery. Journal of Machine Learning Research, 2006, 7: 2003−2030 [13] Hyvärinen A, Shimizu S, Hoyer P O. Causal modelling combining instantaneous and lagged effects: an identifiable model based on non-Gaussianity. In: Proceedings of the 25th International Conference on Machine Learning (ICML), 2008. 424–431. [14] Hyvärinen A, Zhang K, Shimizu S, Hoyer P O. Estimation of a Structural Vector Autoregression Model Using Non-Gaussianity. J. Mach. Learn. Res., 2010, 11: 1709−1731 [15] Zheng X, Aragam B, Ravikumar P K, et al. Dags with no tears: Continuous optimization for structure learning. Advances in Neural Information Processing Systems, 2018, 31. [16] Pamfil R, Sriwattanaworachai N, Desai S, Pilgerstorfer P, Georgatzis K, Beaumont P, Aragam B. DYNOTEARS: Structure learning from time-series data. In: Proceedings of the International Conference on Artificial Intelligence and Statistics (AISTATS), 2020. PMLR. 1595–1605. [17] Sun X, Schulte O, Liu G, Poupart P. NTS-NOTEARS: Learning Nonparametric DBNs With Prior Knowledge. In: Proceedings of the 26th International Conference on Artificial Intelligence and Statistics, Proceedings of Machine Learning Research, 2023, 206: 1942–1964. [18] Kaiser M, Sipos M. Unsuitability of NOTEARS for causal graph discovery when dealing with dimensional quantities. Neural Processing Letters, 2022, 54(3): 1587−1595 doi: 10.1007/s11063-021-10694-5 [19] Granger C W J. Investigating causal relations by econometric models and cross-spectral methods. Econometrica, 1969, 37(3): 424−438 doi: 10.2307/1912791 [20] Nauta M, Bucur D, Seifert C. Causal discovery with attention-based convolutional neural networks. Mach. Learn. Knowl. Extr., 2019, 1(1): 312−340 doi: 10.3390/make1010019 [21] Liang X, Hao K, Chen L, et al. Causal inference of multivariate time series in complex industrial systems. Advanced Engineering Informatics, 2024, 59: 102320 doi: 10.1016/j.aei.2023.102320 [22] Tank A, Covert I, Foti N, et al. Neural Granger causality. IEEE Transactions on Pattern Analysis and Machine Intelligence, 2021, 44(8): 4267−4279 [23] Marinazzo D, Pellicoro M, Stramaglia S. Kernel method for nonlinear Granger causality. Physical Review Letters, 2008, 100(14): 144103 doi: 10.1103/PhysRevLett.100.144103 [24] Ren W, Li B, Han M. A novel Granger causality method based on HSIC-Lasso for revealing nonlinear relationships between multivariate time series. Physica A: Statistical Mechanics and its Applications, 2020, 541: 123245 doi: 10.1016/j.physa.2019.123245 [25] Gu A, Dao T, Ermon S, et al. Hippo: Recurrent memory with optimal polynomial projections. Advances in Neural Information Processing Systems, 2020, 33: 1474−1487 [26] Gu A, Goel K, Gupta A, et al. On the parameterization and initialization of diagonal state space models. Advances in Neural Information Processing Systems, 2022, 35: 35971−35983 [27] Gu A, Dao T. Mamba: Linear-time sequence modeling with selective state spaces. arXiv preprint arXiv: 2312.00752, 2023. [28] 张宪法, 郝矿荣, 陈磊. 免疫多域特征融合的多核学习SVM运动想象脑电信号分类. 自动化学报, 2020, 46(11): 2417−2426Zhang Xian-Fa, Hao Kuang-Rong, Chen Lei. Motor imagery EEG classification based on immune Multi- domain-feature fusion and multiple kernel learning SVM. Acta Automatica Sinica, 2020, 46(11): 2417−2426 [29] Korda M, Mezic I. Optimal construction of Koopman eigenfunctions for prediction and control. IEEE Transactions on Automatic Control, 2020, 65(12): 5114−5129 doi: 10.1109/TAC.2020.2978039 [30] Bevanda P, Beier M, Lederer A, et al. Koopman kernel regression. Advances in Neural Information Processing Systems, 2024, 36. [31] Micchelli C A, Pontil M. On learning vector-valued functions. Neural Computation, 2005, 17(1): 177−204 doi: 10.1162/0899766052530802 [32] Karimi A, Paul M R. Extensive chaos in the Lorenz-96 model. Chaos: An Interdisciplinary Journal of Nonlinear Science, 2010, 20(4): 043105 doi: 10.1063/1.3496397 [33] Smith S M, Miller K L, Salimi-Khorshidi G, Webster M, Beckmann C F, Nichols T E, Ramsey J D, Woolrich M W. Network modelling methods for fMRI. Neuroimage, 2011, 54: 8751−8754 [34] Khanna S, Tan V Y F. Economy statistical recurrent units for inferring nonlinear Granger causality. In: International Conference on Learning Representations, 2020. [35] Marcinkevičs R, Vogt J E. Interpretable models for Granger causality using self-explaining neural networks. In: Proceedings of the International Conference on Learning Representations, 2021. [36] Li H, Yu S, Principe J. Causal recurrent variational autoencoder for medical time series generation. In: Proceedings of the AAAI Conference on Artificial Intelligence, 2023, 37(7): 8562–8570. [37] Ding H, Hao K, Chen L, et al. Feature structured domain adaptation for quality prediction of cross working conditions in industrial processes. Journal of Manufacturing Systems, 2024, 74: 887−900 doi: 10.1016/j.jmsy.2024.05.011 -

计量
- 文章访问数: 6
- HTML全文浏览量: 3
- 被引次数: 0
