

Regularized Linear Discriminant Analysis Based on Uncertainty Sets From Kullback-Leibler Divergence
-
摘要: 线性判别分析是一种统计学习方法. 针对线性判别分析的小样本奇异性问题和对污染样本敏感性问题, 目前许多线性判别分析的改进算法已被提出. 本文提出了基于Kullback-Leibler (KL)散度不确定集的判别分析方法. 提出的方法不仅利用了Ls范数定义类间距离和Lr范数定义类内距离, 而且对类内样本和各类中心的信息进行基于KL散度不确定集的概率建模. 首先通过优先考虑不利区分的样本提出了一种正则化对抗判别分析模型并利用广义Dinkelbach算法求解此模型. 这种算法的一个优点是在适当的条件下优化子问题不需要取得精确解. 投影(次)梯度法被用来求解优化子问题. 此外, 也提出了正则化乐观判别分析并采用交替优化技术求解广义Dinkelbach算法的优化子问题. 许多数据集上的实验表明了本文的模型优于现有的一些模型, 特别是在污染的数据集上, 正则化乐观判别分析由于优先考虑了类中心附近的样本点, 从而表现出良好的性能.Abstract: Linear discriminant analysis is a statistical learning method. For the singularity problem of small samples and the sensitivity to contaminated samples, now many improved algorithms of linear discriminant analysis have been proposed. In this paper we propose discriminant analysis methods via uncertainty sets from the Kullback-Leibler (KL) divergence. The proposed methods not only employ the Ls norm to define the distance between classes and the Lr norm to define the distance within classes, but also implement the probability modeling for within-class samples and class means based on uncertainty sets from the KL divergence. This paper first proposes a regularized adversarial discriminant analysis model by placing more emphasis on the samples that are difficult to be separated and then the generalized Dinkelbach's algorithm is used to solve the proposed optimization model. One advantage of this method is that the optimization subproblems do not need to be solved precisely under proper conditions. In addition, this paper also proposes regularized optimistic discriminant analysis and uses the alternative optimization technique to solve optimization subproblems in the generalized Dinkelbach's algorithm. Experiments on many data sets show that the proposed models are superior to some existing models. Especially on the contaminated data sets regularized optimistic discriminant analysis produces better performance since it places more emphasis on the samples which lie around class means.
-
Key words:
- Discriminant analysis /
- KL divergence /
- uncertainty sets /
- regularization /
- data classification
-
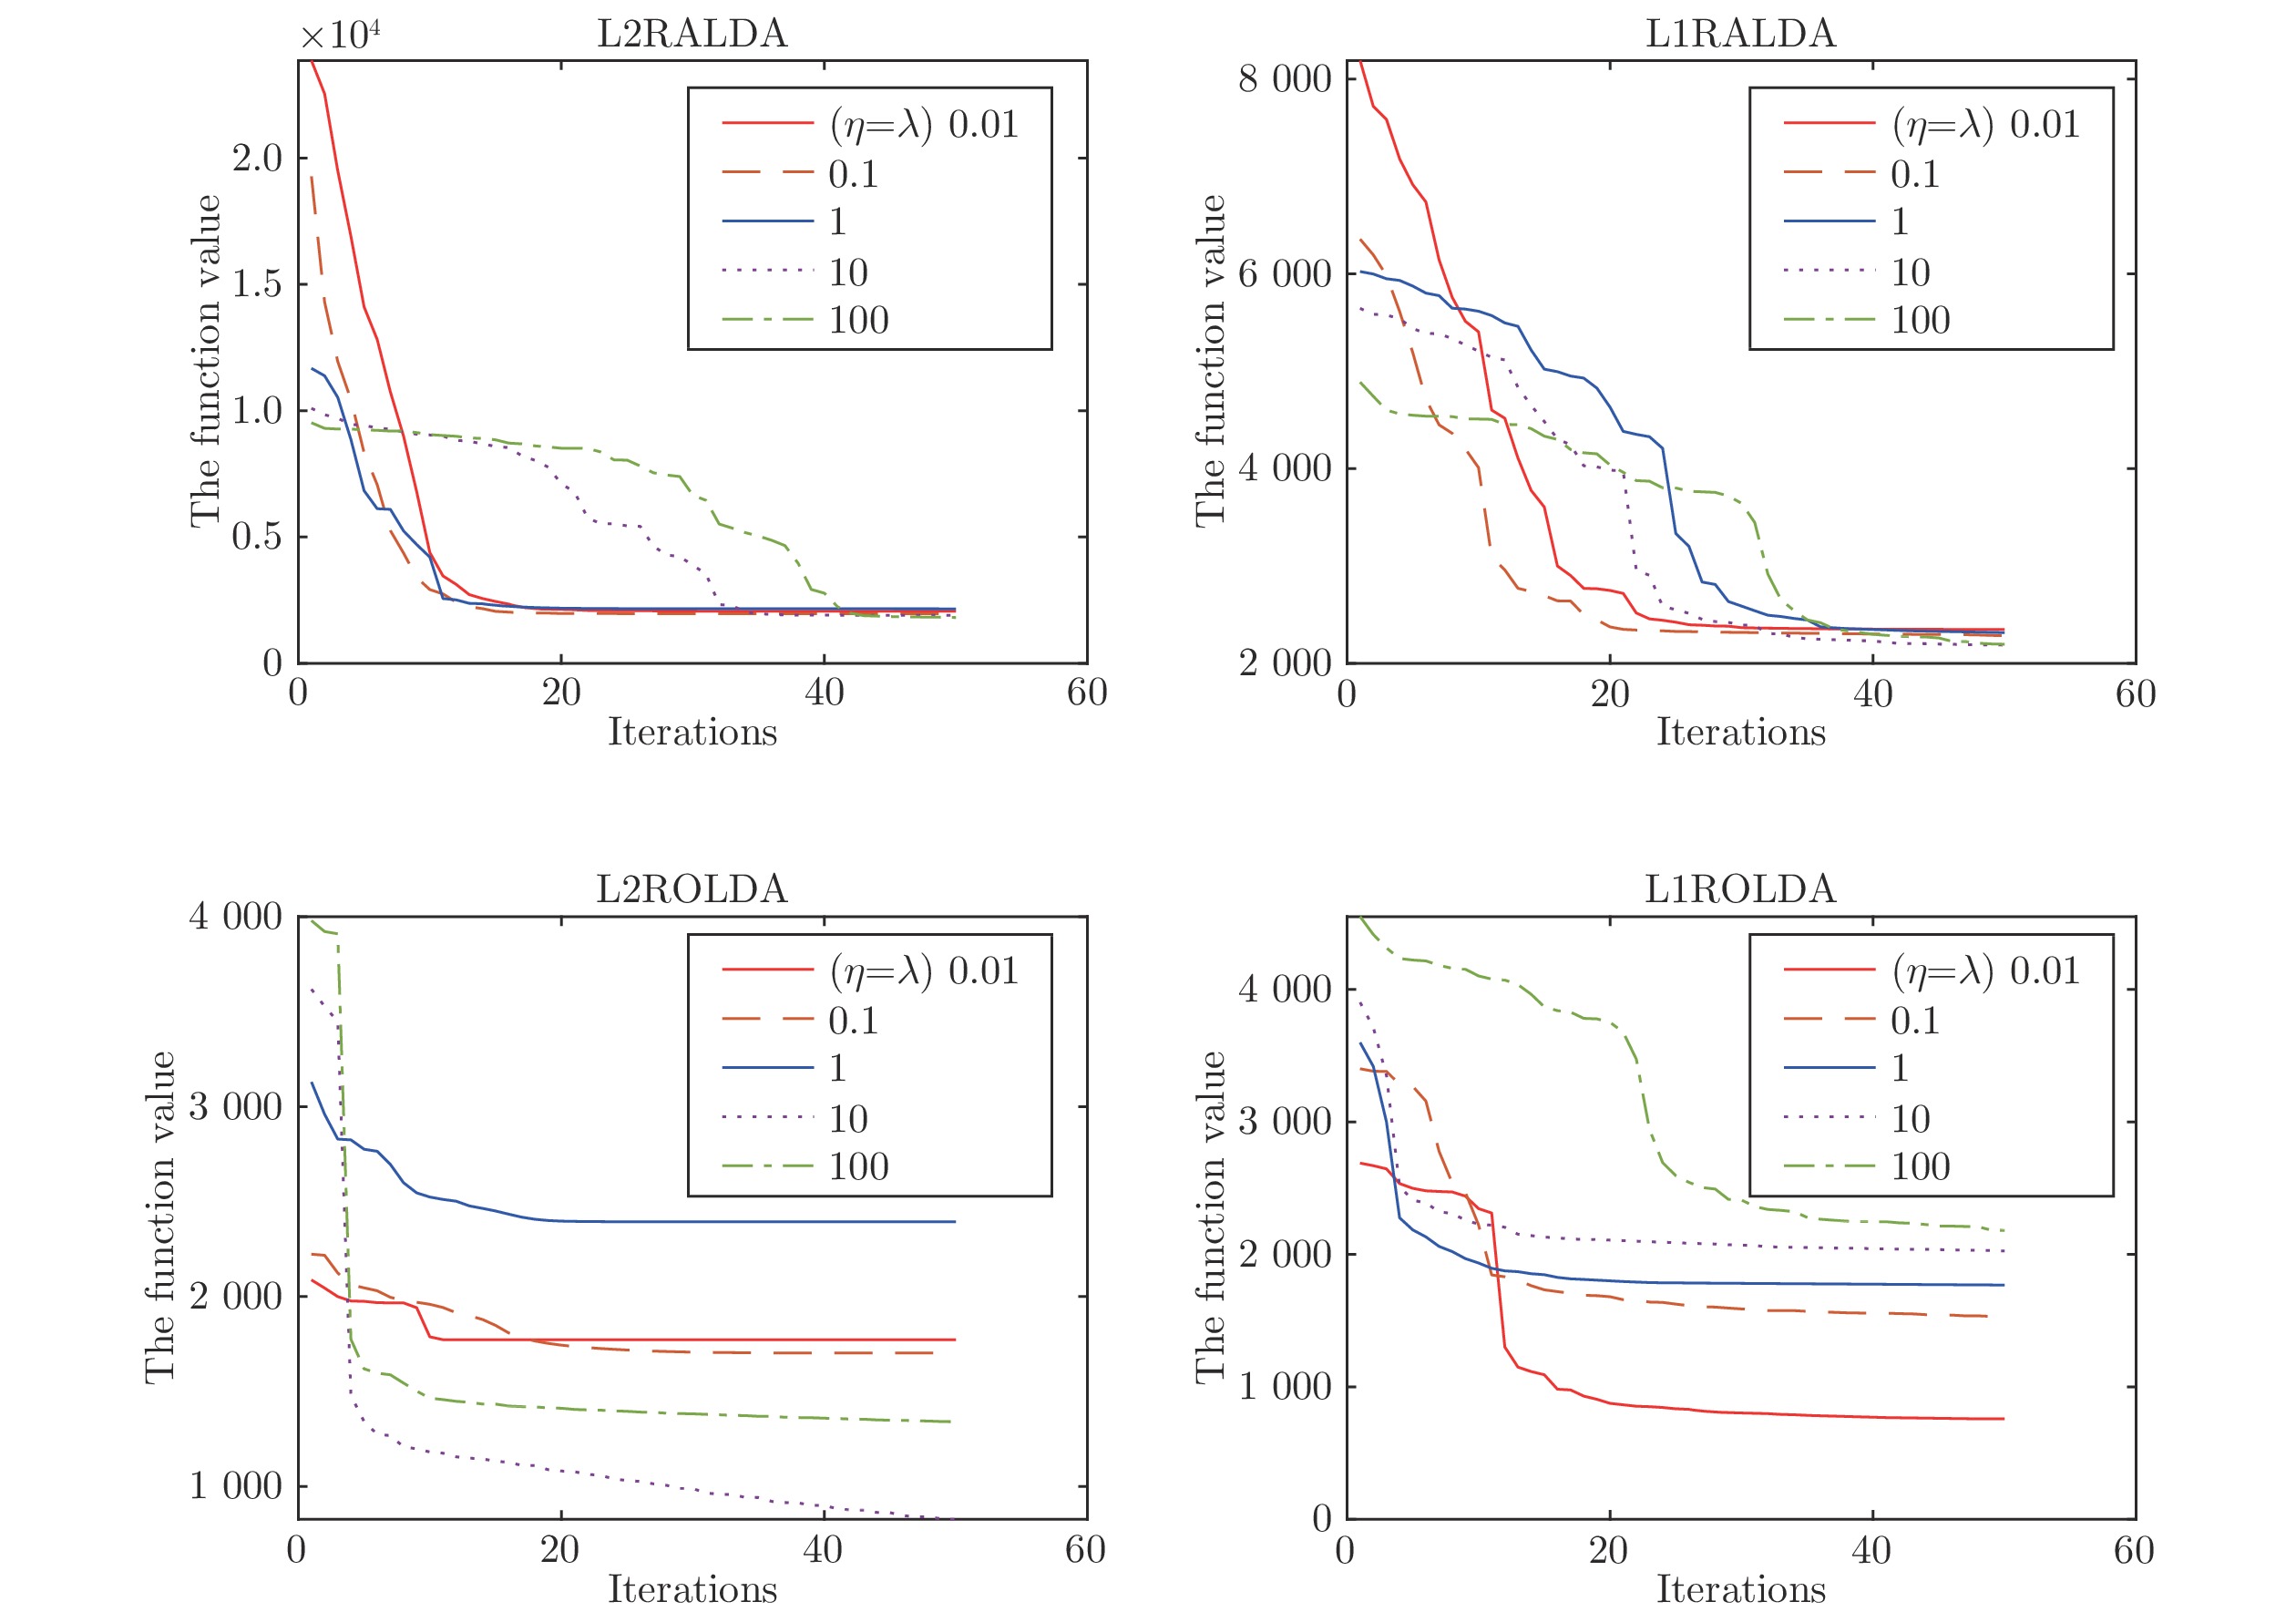
图 1 L2RALDA, L1RALDA, L2ROLDA和L1ROLDA的收敛性分析
Fig. 1 Convergence analysis of L2RALDA, L1RALDA, L2ROLDA and L1ROLDA
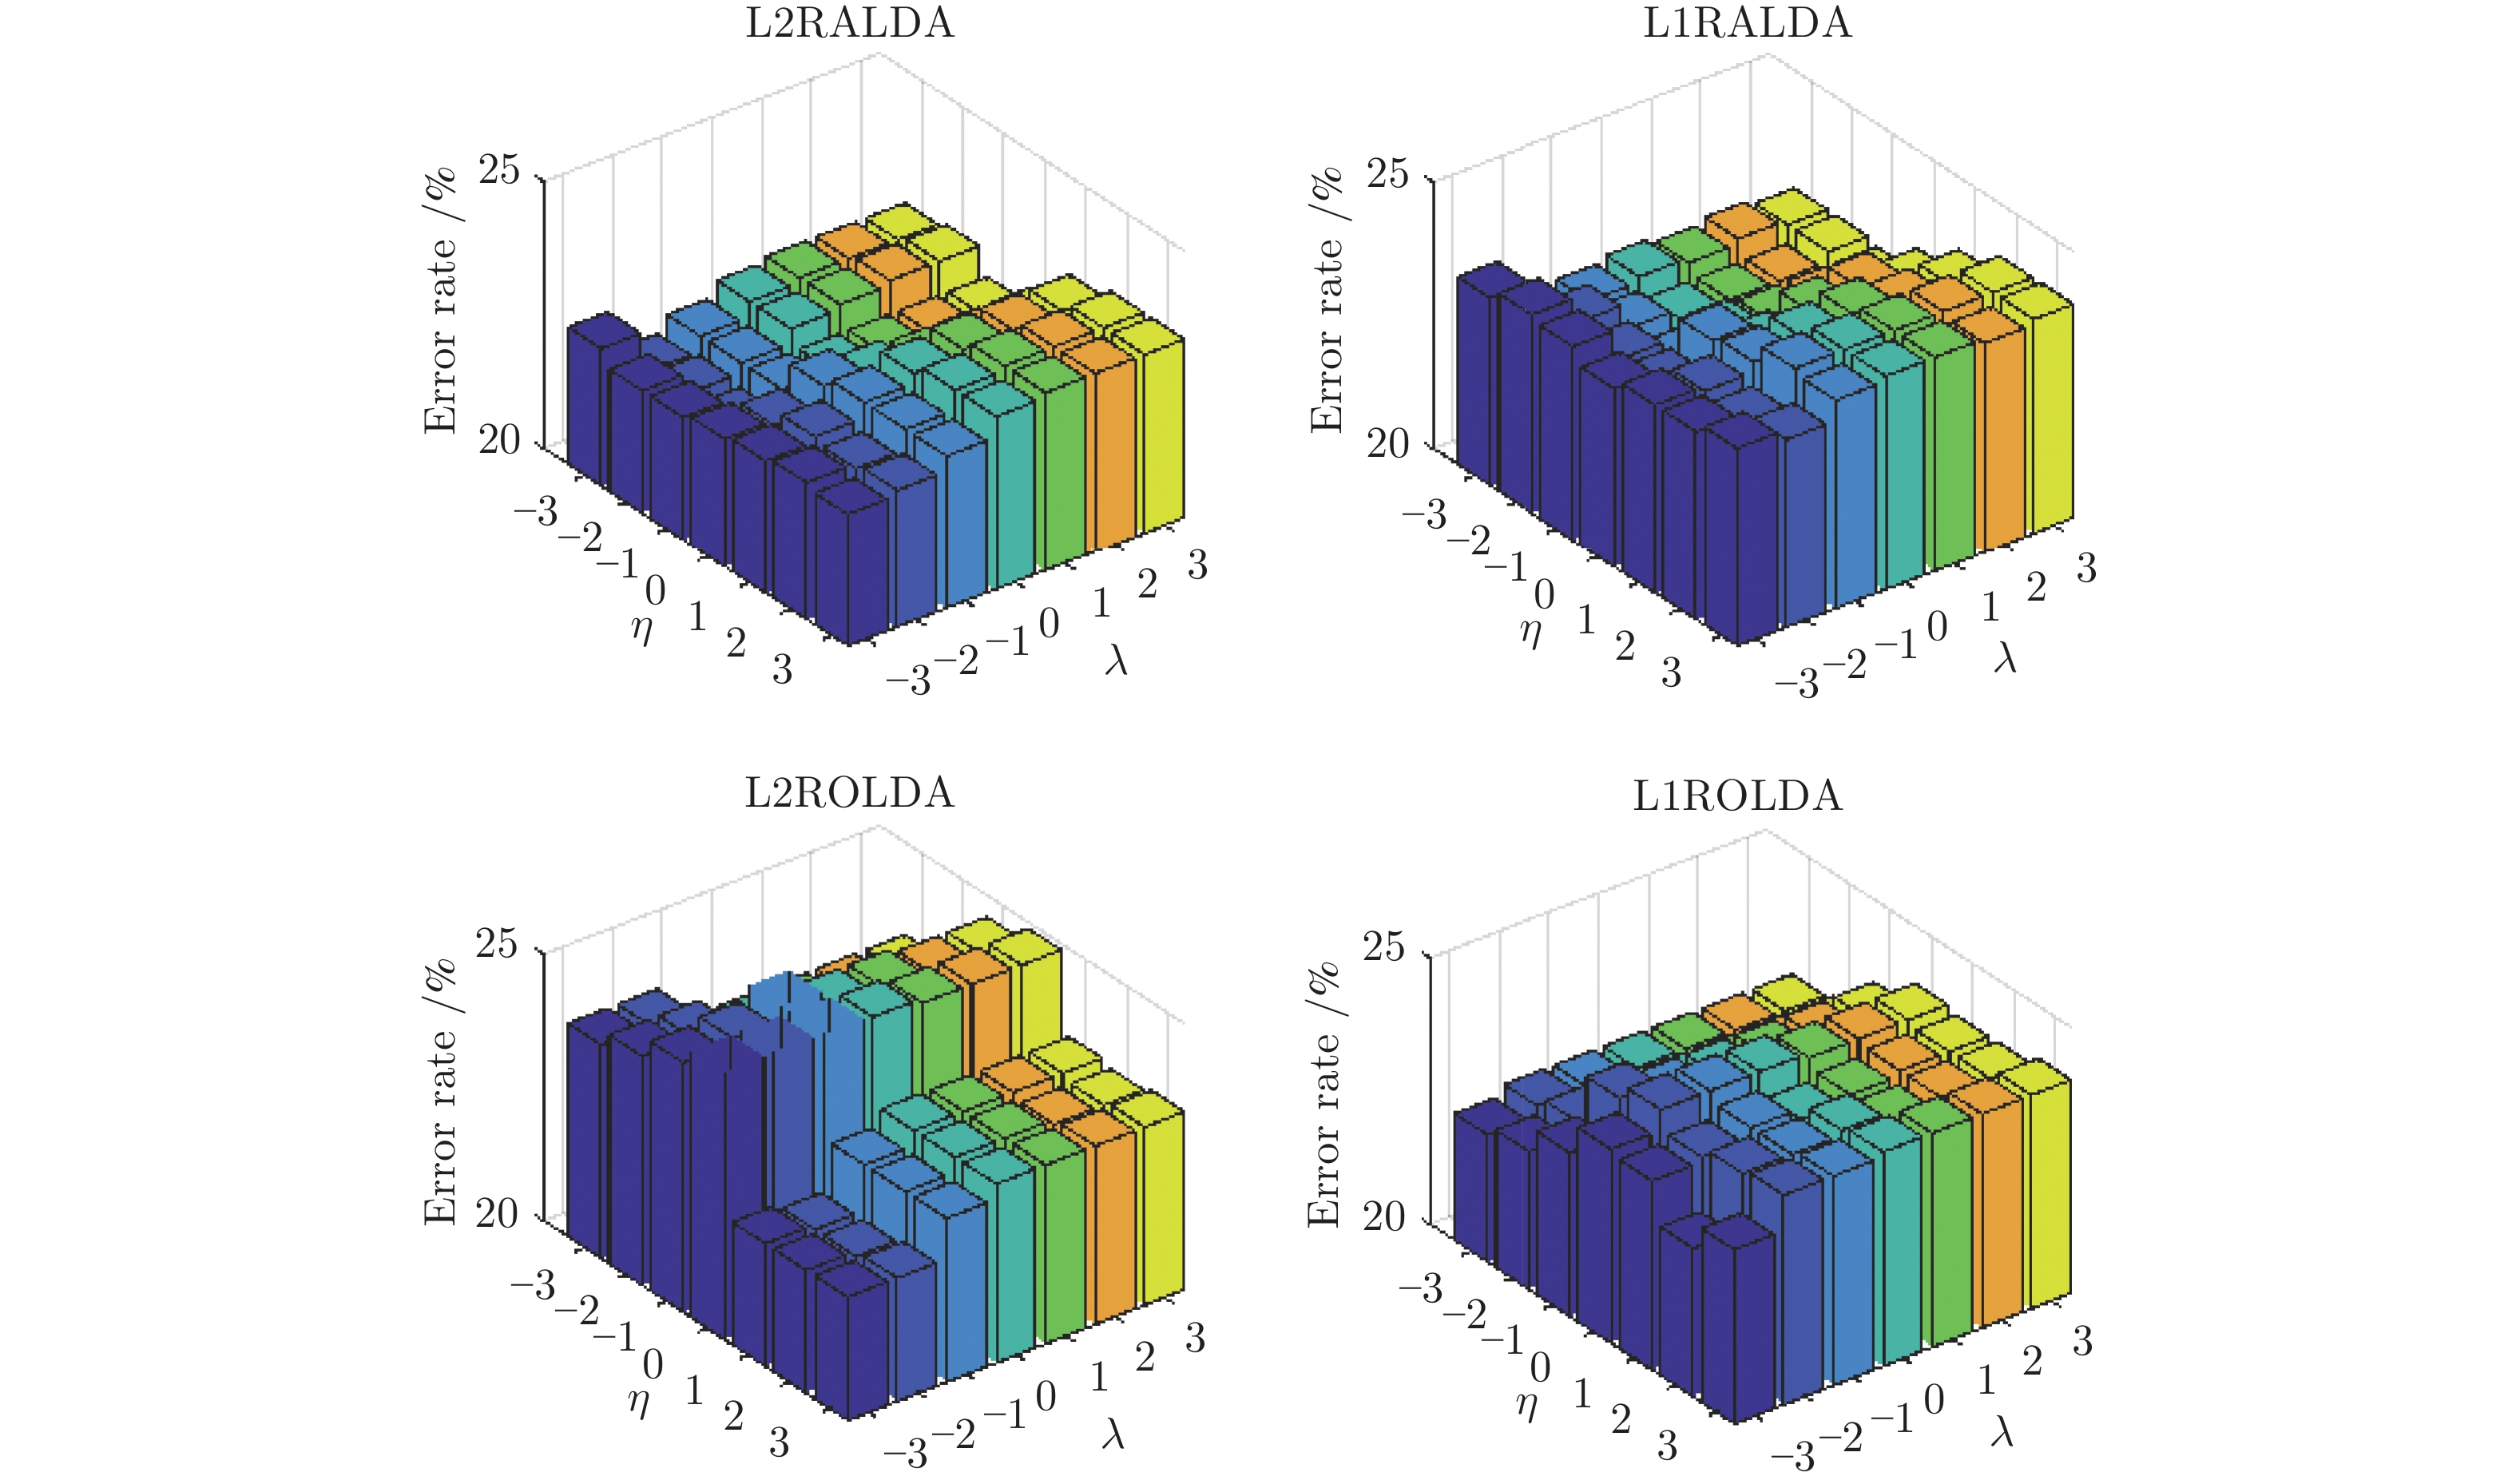
图 2 L2RALDA, L1RALDA, L2ROLDA和L1ROLDA的错误率与参数的关系
Fig. 2 Error rates of L2RALDA, L1RALDA, L2ROLDA and L1ROLDA versus the parameters
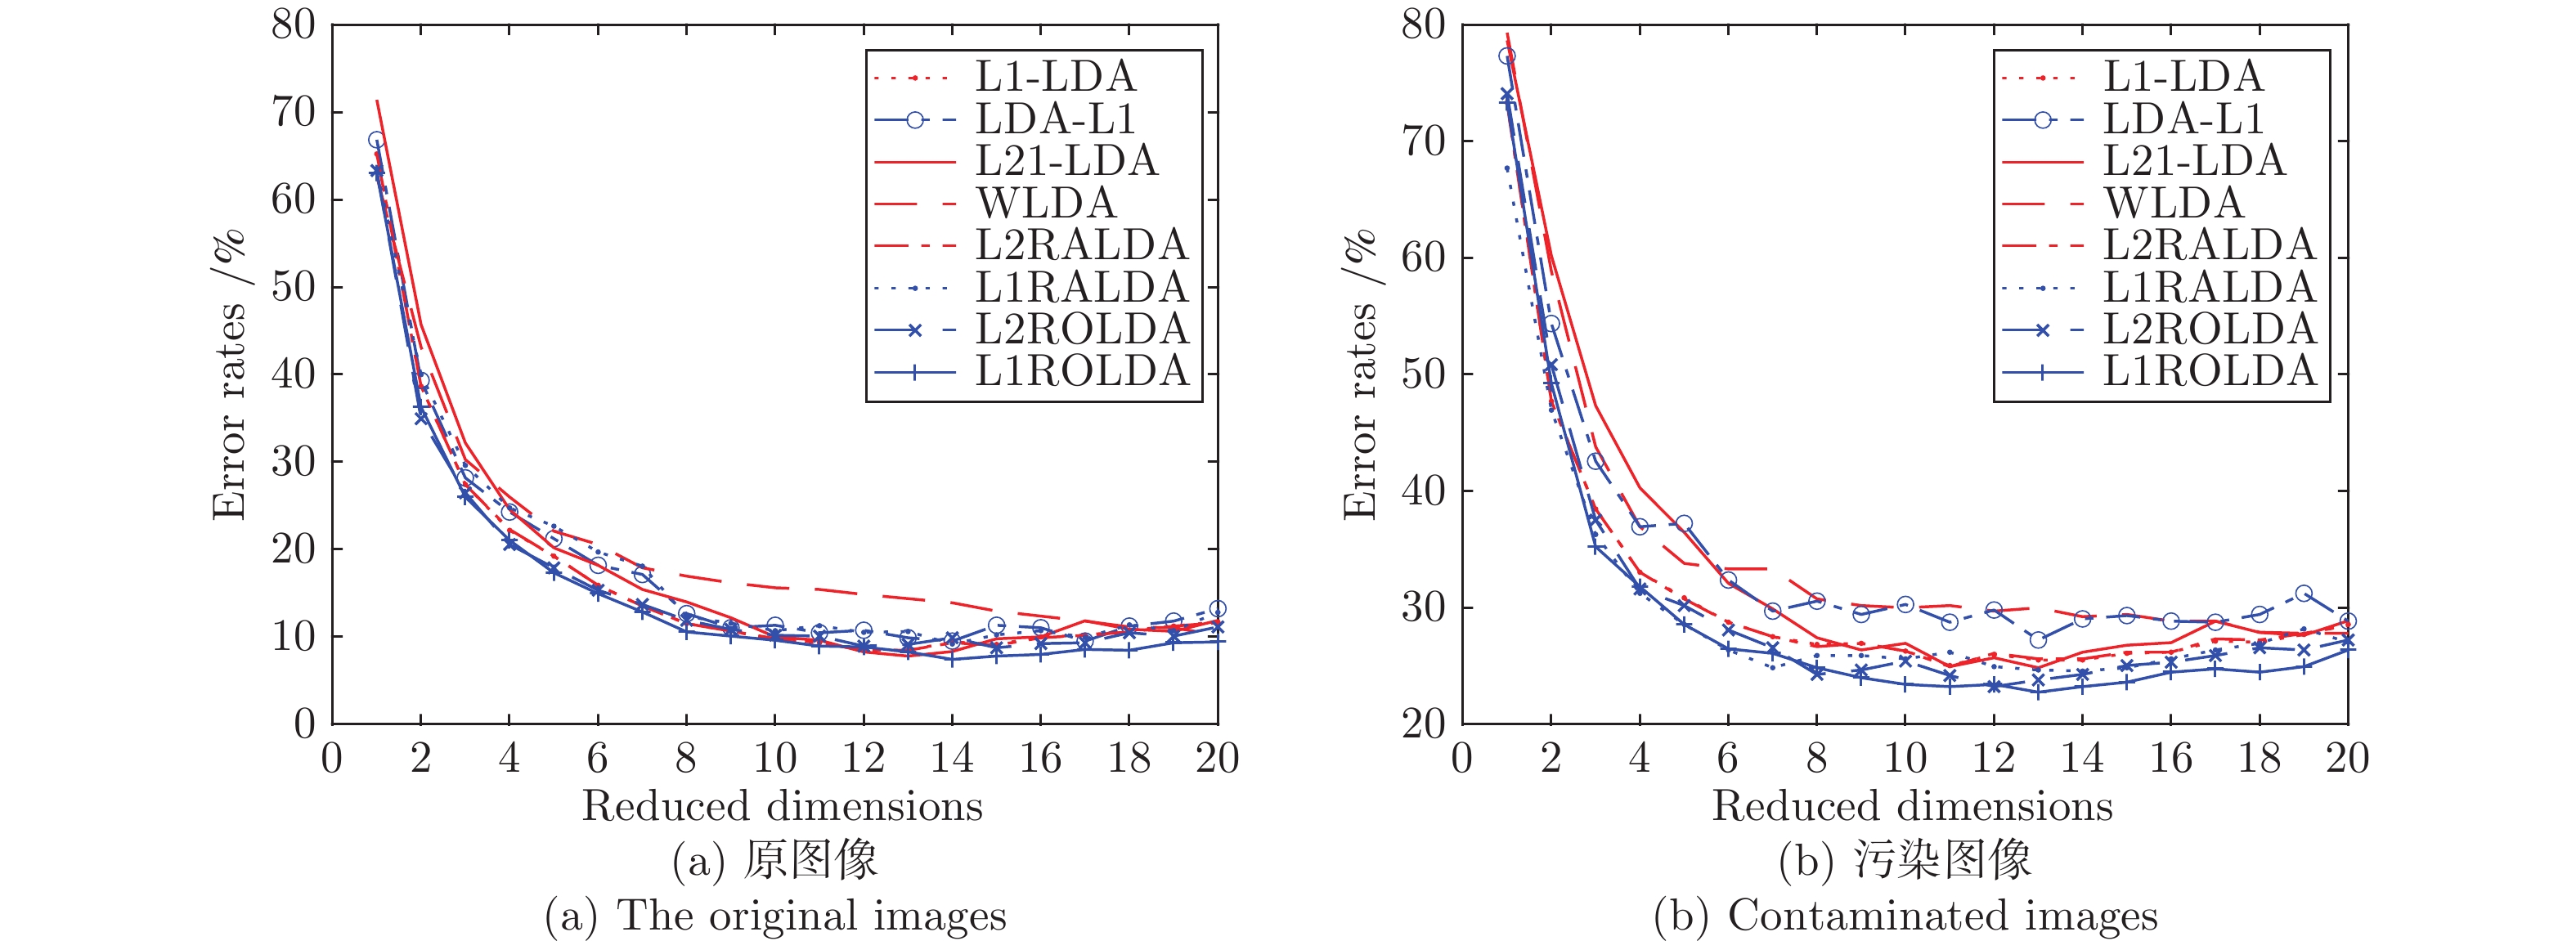
图 3 数据集上不同方法随维数变化的错误率
Fig. 3 Error rates of various methods with varying dimensions on the Yale database
表 1 各种方法在原始数据集和污染数据集上的平均错误率(%)和标准偏差
Table 1 Average error rates (%) of various methods and their standard deviations on the original and contaminated data sets
Data sets L1-LDA LDA-L1 L21-LDA WLDA L2RALDA L1RALDA L2ROLDA L1ROLDA Yale 8.48 (3.42) 9.52 (3.47) 7.81 (4.21) 10.19 (3.24) 8.48 (4.25) 9.19 (3.96) 8.76 (3.84) 7.46 (3.10) C-Yale 24.95 (4.76) 25.05 (5.05) 24.86 (4.98) 27.81 (4.87) 27.24 (4.92) 24.57 (4.58) 23.24 (4.49) 22.76 (4.12) ORL 9.89 (2.13) 0.21 (2.06) 8.86 (2.45) 10.33 (2.02) 8.98 (2.15) 8.34 (2.12) 9.66 (2.18) 9.19 (1.92) C-ORL 14.62 (2.41) 15.27 (2.32) 13.98 (2.73) 15.92 (2.85) 15.82 (2.67) 13.13 (2.63) 13.45 (2.49) 12.58 (2.52) UMIST 8.99 (2.09) 9.23 (2.07) 8.87 (2.75) 10.15 (2.02) 9.42 (2.15) 8.83 (2.12) 9.07 (2.18) 8.98 (1.99) C-UMIST 24.52 (3.89) 26.33 (3.93) 22.98 (3.85) 29.23 (3.84) 23.39 (4.04) 23.52 (3.92) 23.22 (3.88) 21.90 (3.72) COIL 18.45 (2.02) 19.46 (1.64) 18.21 (1.65) 19.97 (1.79) 19.05 (1.64) 17.98 (1.46) 18.31 (2.12) 17.42 (2.14) C-COIL 28.34 (3.41) 29.66 (3.49) 27.35 (3.55) 29.01 (3.15) 28.46 (3.43) 27.65 (2.43) 28.32 (3.01) 26.22 (3.32) AR-sunglasses 9.26 (1.73) 9.38 (1.46) 8.05 (1.57) 10.02 (1.70) 9.21 (1.53) 9.01 (1.25) 8.25 (1.23) 7.33 (1.79) AR-scarf 21.29 (1.10) 20.81 (1.25) 19.03 (1.28) 28.02 (0.92) 26.35 (0.89) 20.34 (1.34) 19.38 (1.24) 17.24 (1.34)  下载: 导出CSV
表 2 各种方法在原始数据集上的平均正确率(ACR(%)), 标准偏差(SD)和
$ p $ -值Table 2 Average correct rates (ACR(%)), standard deviations (SD), and
$ p $ -values of various methods on the original data setsData sets L1-LDA LDA-L1 L21-LDA WLDA L2RALDA L1RALDA L2ROLDA L1ROLDA ACR (SD) ACR (SD) ACR (SD) ACR (SD) ACR (SD) ACR (SD) ACR (SD) ACR (SD) $ p $-值 $ p $-值 $ p $-值 $ p $-值 $ p $-值 $ p $-值 $ p $-值 $ p $- 值 Australian 82.22 (3.44) 80.15 (3.36) 83.44 (3.57) 80.12 (3.29) 79.15 (3.61) 82.99 (3.46) 79.77 (3.27) 84.12 (3.63) 7.98$ \times 10^{-3} $ 3.13$ \times 10^{-5} $ 0.43 3.00$ \times 10^{-5} $ 1.45$ \times 10^{-5} $ 0.028 1.78$ \times 10^{-5} $ — Diabetes 72.55 (4.51) 71.68 (4.62) 73.28 (4.33) 70.19 (4.40) 71.18 (4.71) 72.87 (4.26) 71.99 (4.27) 72.68 (4.39) 0.22 0.15 0.84 0.0084 0.10 0.46 0.19 — German 74.45 (3.66) 72.02 (3.69) 74.68 (3.88) 69.34 (3.77) 72.06 (3.54) 74.99 (3.49) 72.67 (3.66) 73.74 (3.48) 0.03 1.30$ \times 10^{-3} $ 0.04 6.39$ \times 10^{-4} $ 7.84$ \times 10^{-3} $ 0.04 0.01 — Heart 75.89 (5.11) 74.36 (5.13) 77.32 (5.16) 73.53 (5.17) 74.22 (5.22) 77.52 (5.34) 75.67 (5.54) 78.98 (5.19) 8.94$ \times 10^{-4} $ 5.99$ \times 10^{-5} $ 0.012 3.72$ \times 10^{-6} $ 4.81$ \times 10^{-5} $ 0.043 1.14$ \times 10^{-4} $ — Liver 65.25 (4.33) 63.27 (4.78) 64.34 (4.99) 62.87 (4.60) 62.99 (4.71) 64.12 (4.37) 63.01 (4.48) 64.54 (4.29) 0.52 0.89 0.28 0.074 0.08 0.68 0.51 — Sonar 72.11 (4.98) 70.99 (4.96) 73.16 (5.52) 70.21 (5.43) 70.68 (5.06) 72.45 (5.21) 70.99 (5.29) 73.22 (5.16) 0.06 6.07$ \times 10^{-4} $ 0.72 3.80$ \times 10^{-4} $ 4.45$ \times 10^{-4} $ 0.074 6.69$ \times 10^{-4} $ — Waveform 83.27 (1.99) 82.18 (2.12) 85.12 (1.88) 81.23 (1.94) 81.53 (2.15) 83.69 (2.22) 81.49 (2.10) 86.28 (1.98) 1.93$ \times 10^{-5} $ 8.97$ \times 10^{-6} $ 0.08 1.42$ \times 10^{-6} $ 1.83$ \times 10^{-6} $ 7.10$ \times 10^{-5} $ 1.57$ \times 10^{-6} $ — WPBC 77.89 (5.19) 75.32 (5.23) 78.23 (5.44) 72.12 (5.37) 73.14 (5.21) 79.33 (5.36) 72.99 (5.28) 77.89 (5.29) 0.47 1.67$ \times 10^{-4} $ 0.17 1.19$ \times 10^{-5} $ 1.58$ \times 10^{-5} $ 4.76$ \times 10^{-3} $ 6.08$ \times 10^{-6} $ —
下载: 导出CSV
表 3 各种方法在污染数据集上的平均正确率(ACR(%)), 标准偏差(SD)和
$ p $ -值Table 3 Average correct rates (ACR(%)), standard deviations (SD), and
$ p $ -values of various methods on the contaminated data setsData sets L1-LDA LDA-L1 L21-LDA WLDA L2RALDA L1RALDA L2ROLDA L1ROLDA ACR (SD) ACR (SD) ACR (SD) ACR (SD) ACR (SD) ACR (SD) ACR (SD) ACR (SD) $ p $-值 $ p $-值 $ p $-值 $ p $- 值 $ p $-值 $ p $-值 $ p $-值 Australian 80.45 (3.56) 78.34 (3.77) 81.65 (3.46) 75.22 (3.89) 77.26 (3.45) 81.78 (3.66) 79.62 (3.78) 82.51 (3.52) 1.99$ \times 10^{-4} $ 7.89$ \times 10^{-6} $ 0.025 6.02$ \times 10^{-7} $ 5.17$ \times 10^{-6} $ 0.04 2.10$ \times 10^{-5} $ — Diabetes 70.63 (4.22) 69.44 (4.29) 70.32 (4.35) 65.26 (4.65) 69.37 (4.60) 70.65 (4.05) 70.38 (4.30) 70.37 (4.41) 0.41 0.055 0.29 7.55$ \times 10^{-5} $ 0.037 0.49 0.39 — German 71.34 (3.48) 70.08 (3.55) 71.76 (3.22) 64.45 (3.79) 70.05 (3.86) 71.09 (3.94) 71.39 (3.68) 72.36 (3.77) 5.08$ \times 10^{-3} $ 0.92$ \times 10^{-3} $ 1.41$ \times 10^{-2} $ 1.30$ \times 10^{-7} $ 1.80$ \times 10^{-3} $ 0.027 0.099 — Heart 72.05 (5.26) 72.24 (5.45) 72.44 (5.13) 66.53 (4.98) 70.22 (5.26) 70.35 (5.39) 71.51 (4.99) 74.88 (5.10) 3.06$ \times 10^{-3} $ 1.58$ \times 10^{-3} $ 8.12$ \times 10^{-3} $ 2.03$ \times 10^{-6} $ 0.35$ \times 10^{-4} $ 1.06$ \times 10^{-4} $ 0.67$ \times 10^{-3} $ — Liver 62.67 (4.33) 60.67 (4.59) 62.53 (4.25) 59.36 (4.78) 60.08 (4.32) 62.04 (4.64) 61.01 (4.13) 63.98 (4.31) 0.047 9.79$ \times 10^{-4} $ 0.039 1.51$ \times 10^{-4} $ 2.75$ \times 10^{-4} $ 0.032 7.22$ \times 10^{-3} $ — Sonar 70.56 (5.71) 68.89 (5.96) 71.37 (5.34) 66.19 (5.39) 68.34 (5.30) 70.32 (5.41) 69.82 (5.27) 71.02 (5.19) 0.17 9.16$ \times 10^{-4} $ 0.55 6.18$ \times 10^{-5} $ 2.34$ \times 10^{-4} $ 0.12 6.99$ \times 10^{-2} $ — Waveform 80.46 (1.89) 79.04 (2.03) 81.08 (1.96) 79.28 (1.89) 80.56 (1.95) 81.75 (2.02) 80.73 (2.11) 82.28 (2.03) 4.47$ \times 10^{-3} $ 1.54$ \times 10^{-5} $ 0.03 4.69$ \times 10^{-5} $ 5.27$ \times 10^{-3} $ 0.18 6.33$ \times 10^{-3} $ — WPBC 73.44 (5.10) 71.35 (5.15) 73.31 (5.27) 70.25 (5.29) 70.21 (5.33) 72.21 (5.39) 70.82 (5.42) 74.76 (5.22) 0.49 2.30$ \times 10^{-2} $ 0.34 3.17$ \times 10^{-3} $ 2.96$ \times 10^{-3} $ 3.59$ \times 10^{-2} $ 8.34$ \times 10^{-3} $ —
下载: 导出CSV
-
[1] Kan M N, Shan S G, Zhang H H, Lao S H, Chen X L. Multi-view discriminant analysis. IEEE Transactions on Pattern Analysis and Machine Intelligence, 2016, 38(1): 188-194 doi: 10.1109/TPAMI.2015.2435740 [2] Kwak N. Principal component analysis based on L1-norm maximization. IEEE Transactions on Pattern Analysis and Machine Intelligence, 2008, 30(9): 1672-1680 doi: 10.1109/TPAMI.2008.114 [3] Kwak N. Principal component analysis by Lp-norm maximization. IEEE Transactions on Cybernetics, 2014, 44(5): 594-609 doi: 10.1109/TCYB.2013.2262936 [4] 高云龙, 罗斯哲, 潘金艳, 陈柏华, 张逸松. 鲁棒自适应概率加权主成分分析. 自动化学报, 2021, 47(4): 825-838Gao Yun-Long, Luo Si-Zhe, Pan Jin-Yan, Chen Bai-Hua, Zhang Yi-Song. Robust PCA using adaptive probability weighting. Acta Automatica Sinica, 2021, 47(4): 825-838 [5] 何进荣, 闭应洲, 丁立新, 刘斌. 局部差异正则化的边界判别投影. 计算机学报, 2018, 41(4): 780-795 doi: 10.11897/SP.J.1016.2018.00780He Jin-Rong, Bi Ying-Zhou, Ding Li-Xin, Liu Bin. Local variation regularized margin discriminant projection. Chinese Journal of Computers, 2018, 41(4): 780-795 doi: 10.11897/SP.J.1016.2018.00780 [6] Zheng W M, Lin Z C, Wang H X. L1-norm kernel discriminant analysis via Bayes error bound optimization for robust feature extraction. IEEE Transactions on Neural Networks and Learning Systems, 2014, 25(4): 793-805 doi: 10.1109/TNNLS.2013.2281428 [7] Zhong K, Han M, Qiu T, Han B. Fault diagnosis of complex processes using sparse kernel local fisher discriminant analysis. IEEE Transactions on Neural Networks and Learning Systems, 2020, 31(5): 1581-1591 doi: 10.1109/TNNLS.2019.2920903 [8] Iosifidis A, Tefas A, Pitas I. On the optimal class representation in linear discriminant analysis. IEEE Transactions on Neural Networks and Learning Systems, 2013, 24(9): 1491-1497 doi: 10.1109/TNNLS.2013.2258937 [9] Zheng S, Ding C, Nie F P, Huang H. Harmonic mean linear discriminant analysis. IEEE Transactions on Knowledge and Data Engineering, 2019, 31(8): 1520-1531 doi: 10.1109/TKDE.2018.2861858 [10] Nie F P, Wang Z, Wang R, Li X L. Submanifold-preserving discriminant analysis with an auto-optimized graph. IEEE Transactions on Cybernetics, 2020, 50(8): 3682-3695 doi: 10.1109/TCYB.2019.2910751 [11] Lotlikar R, Kothari R. Fractional-step dimensionality reduction. IEEE Transactions on Pattern Analysis and Machine Intelligence, 2000, 22(6): 623-627 doi: 10.1109/34.862200 [12] Loog M, Duin R P W, Haeb-Umbach R. Multiclass linear dimension reduction by weighted pairwise Fisher criteria. IEEE Transactions on Pattern Analysis and Machine Intelligence, 2001, 23(7): 762-766 doi: 10.1109/34.935849 [13] Tao D C, Li X L, Wu X D, Maybank S J. Geometric mean for subspace selection. IEEE Transactions on Pattern Analysis and Machine Intelligence, 2009, 31(2): 260-274 doi: 10.1109/TPAMI.2008.70 [14] Bian W, Tao D C. Harmonic mean for subspace selection. In: Proceedings of the 19th International Conference on Pattern Recognition. Tampa, USA: IEEE, 2008. 1−4 [15] Li Z H, Nie F P, Chang X J, Yang Y. Beyond trace ratio: Weighted harmonic mean of trace ratios for multiclass discriminant analysis. IEEE Transactions on Knowledge and Data Engineering, 2017, 29(10): 2100-2110 doi: 10.1109/TKDE.2017.2728531 [16] Zhang Y, Yeung D Y. Worst-case linear discriminant analysis. In: Proceedings of the 23rd International Conference on Neural Information Processing Systems. Vancouver, Canada: Curran Associates Inc., 2010. 2568−2576 [17] Bian W, Tao D C. Max-min distance analysis by using sequential SDP relaxation for dimension reduction. IEEE Transactions on Pattern Analysis and Machine Intelligence, 2011, 33(5): 1037-1050 doi: 10.1109/TPAMI.2010.189 [18] Flamary R, Cuturi M, Courty N, Rakotomamonjy A. Wasserstein discriminant analysis. Machine Learning, 2018, 107(12): 1923-1945 doi: 10.1007/s10994-018-5717-1 [19] Zhao X W, Guo J, Nie F P, Chen L, Li Z H, Zhang H X. Joint principal component and discriminant analysis for dimensionality reduction. IEEE Transactions on Neural Networks and Learning Systems, 2020, 31(2): 433-444 doi: 10.1109/TNNLS.2019.2904701 [20] Cao M, Chen C, Hu X Y, Peng S L. Towards fast and kernelized orthogonal discriminant analysis on person re-identification. Pattern Recognition, 2019, 94: 218-229 doi: 10.1016/j.patcog.2019.05.035 [21] Shawe-Taylor J, Cristianini N. Kernel methods for Pattern Analysis. New York: Cambridge University Press, 2004. [22] Tao D P, Guo Y N, Li Y T, Gao X B. Tensor rank preserving discriminant analysis for facial recognition. IEEE Transactions on Image Processing, 2018, 27(1): 325-334 doi: 10.1109/TIP.2017.2762588 [23] Liu J C, Lian Z H, Wang Y, Xiao J G. Incremental kernel null space discriminant analysis for novelty detection. In: Proceedings of the 2017 IEEE conference on Computer Vision and Pattern Recognition (CVPR). Honolulu, USA: IEEE, 2017. 4123−4131 [24] Pang S N, Ozawa S, Kasabov N. Incremental linear discriminant analysis for classification of data streams. IEEE Transactions on Systems, Man, and Cybernetics, Part B (Cybernetics), 2005, 35(5): 905-914 doi: 10.1109/TSMCB.2005.847744 [25] Zhao H F, Wang Z, Nie F P. A new formulation of linear discriminant analysis for robust dimensionality reduction. IEEE Transactions on Knowledge and Data Engineering, 2019, 31(4): 629-640 doi: 10.1109/TKDE.2018.2842023 [26] Zheng W M, Lu C, Lin Z C, Zhang T, Cui Z, Yang W K. ℓ1-norm heteroscedastic discriminant analysis under mixture of Gaussian distributions. IEEE Transactions on Neural Networks and Learning Systems, 2019, 30(10): 2898-2915 doi: 10.1109/TNNLS.2018.2863264 [27] Ye Q L, Yang J, Liu F, Zhao C X, Ye N, Yin T M. L1-norm distance linear discriminant analysis based on an effective iterative algorithm. IEEE Transactions on Circuits and Systems for Video Technology, 2018, 28(1): 114-129 doi: 10.1109/TCSVT.2016.2596158 [28] Zhong F J, Zhang J S. Linear discriminant analysis based on L1-norm maximization. IEEE Transactions on Image Processing, 2013, 22(8): 3018-3027 doi: 10.1109/TIP.2013.2253476 [29] Wang H X, Lu X S, Hu Z L, Zheng W M. Fisher discriminant analysis with L1-norm. IEEE Transactions on Cybernetics, 2014, 44(6): 828-842 doi: 10.1109/TCYB.2013.2273355 [30] Li X L, Pang Y W, Yuan Y. L1-norm-based 2DPCA. IEEE Transactions on Systems, Man, and Cybernetics, Part B (Cybernetics), 2010, 40(4): 1170-1175 doi: 10.1109/TSMCB.2009.2035629 [31] Liu Y, Gao Q X, Miao S, Gao X B, Nie F P, Li Y S. A non-greedy algorithm for L1-norm LDA. IEEE Transactions on Image Processing, 2017, 26(2): 684-695 doi: 10.1109/TIP.2016.2621667 [32] Li C N, Shang M Q, Shao Y H, Xu Y, Liu L M, Wang Z. Sparse L1-norm two dimensional linear discriminant analysis via the generalized elastic net regularization. Neurocomputing, 2019, 337: 80-96 doi: 10.1016/j.neucom.2019.01.049 [33] Li C N, Shao Y H, Wang Z, Deng N Y, Yang Z M. Robust Bhattacharyya bound linear discriminant analysis through an adaptive algorithm. Knowledge-Based Systems, 2019, 183: Article No. 104858 [34] Nie F P, Wang Z, Wang R, Wang Z, Li X L. Towards robust discriminative projections learning via non-greedy ℓ2,1ℓ2,1-norm MinMax. IEEE Transactions on Pattern Analysis and Machine Intelligence, 2021, 43(6): 2086-2100 doi: 10.1109/TPAMI.2019.2961877 [35] Bishop C M. Pattern Recognition and Machine Learning. New York: Springer, 2006. [36] Liang Z Z, Chen X W, Zhang L, Liu J, Zhou Y. Correlation classifiers based on data perturbation: New formulations and algorithms. Pattern Recognition, 2020, 100: Article No. 107106 [37] Ben-Tal A, den Hertog D, De Waegenaere A, Melenberg B, Rennen G. Robust solutions of optimization problems affected by uncertain probabilities. Management Science, 2012, 59(2): 341-357 [38] Bonnans J F, Shapiro A. Optimization problems with perturbations: A guided tour. SIAM Review, 1998, 40(2): 228-264 doi: 10.1137/S0036144596302644 [39] Ródenas R G, López M L, Verastegui D. Extensions of Dinkelbach's algorithm for solving non-linear fractional programming problem. Top, 1999, 7(1): 33-70 doi: 10.1007/BF02564711 [40] Demšar J. Statistical comparisons of classifiers over multiple data sets. The Journal of Machine Learning Research, 2006, 7: 1-30 [41] Absil P A, Mahony R, Sepulchre R. Optimization Algorithms on Matrix Manifolds. Princeton: Princeton University Press, 2008. -

 下载:
下载:


计量
- 文章访问数: 1369
- HTML全文浏览量: 563
- PDF下载量: 175
- 被引次数: 0
