

-
摘要:
无纺布生产过程中产生的疵点会严重影响产品质量并限制生产效率. 提高疵点检测的自动化程度对于无纺布的生产效率和质量管控至关重要. 传统疵点检测方法难以应对纹理、疵点类型以及环境变化等问题, 限制了其应用范围. 近年来基于卷积神经网络的方法在疵点检测领域得到了广泛应用, 具有泛化性强、准确度高的特点. 但是在无纺布生产过程中, 布匹宽度大、速度快的特点会产生大量图像数据, 基于卷积神经网络的方法难以实现实时检测. 针对上述难题, 本文提出了一种基于最大稳定极值区域分析与卷积神经网络协同的疵点实时检测方法, 并设计了分布式计算处理架构应对数据流过大的问题. 在实际生产部署应用中, 本文所设计的系统与算法无需使用专用计算硬件(GPU、FPGA等), 通过8台工控机与16路工业摄像头对复卷机上布宽2.8 m、速度30 m/min的无纺布进行分布式实时在线检测, 大幅度提高无纺布生产中疵点检测的自动化程度与效率. 本文所提出的系统能够实现对0.3 mm以上疵点召回率100%, 对0.1 mm丝状疵点召回率98.8%.
Abstract:The defects generated during the production process of non-woven fabric will seriously affect the quality and limit the efficiency. How to improve the automatic degree of non-woven fabric defects detection plays a significant role. The traditional defects detection methods cannot deal with the changing of texture, defects type and environments, which limits the application scope. In recent years, the methods based on convolutional neural networks (CNNs) have been widely used in the field of defects detection, which are shown to have the characteristics of strong generalization ability and high accuracy. However, in the non-woven fabric production process, the large width and high speed of cloth will introduce huge amount of image data, which makes it difficult for CNN based methods to achieve real-time detection. In this paper, a real-time defects detection method based on stable extremal region analysis and CNN is proposed, and a distributed computing architecture is designed to handle the problem of large image data stream. In the actual deployment application, the system designed in this paper does not need specific computing hardware (GPU, FPGA, etc.). 8 industrial computers and 16 industrial cameras are coupled together in a distribution scheme to finish real-time defects detection of non-woven fabric rewinder with cloth width 2.8 m and speed 30 m/min, which greatly improves the automation and production efficiency. The system proposed in this paper can achieve 100% recall rate of punctiform defects above 0.3 mm and 98.8% recall rate of 0.1 mm filiform defects.
-
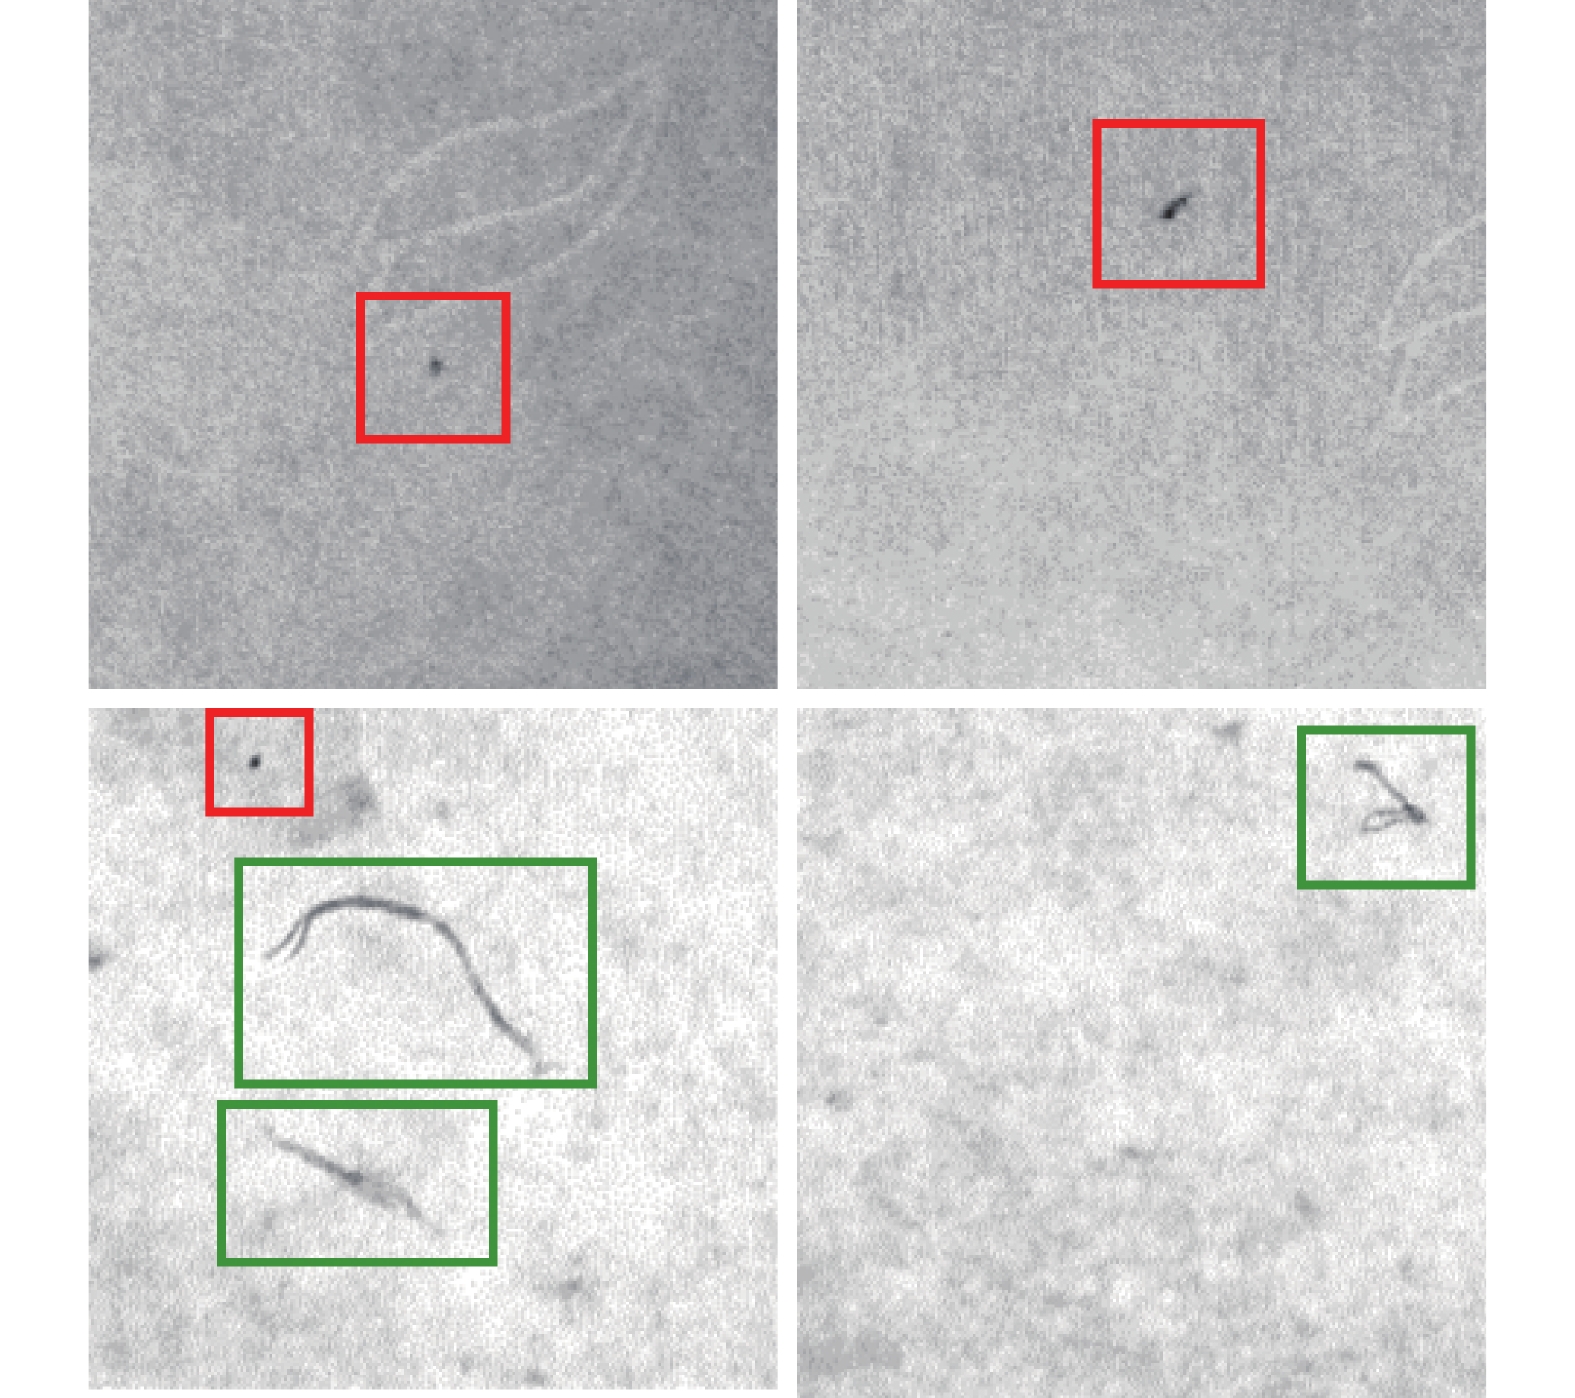
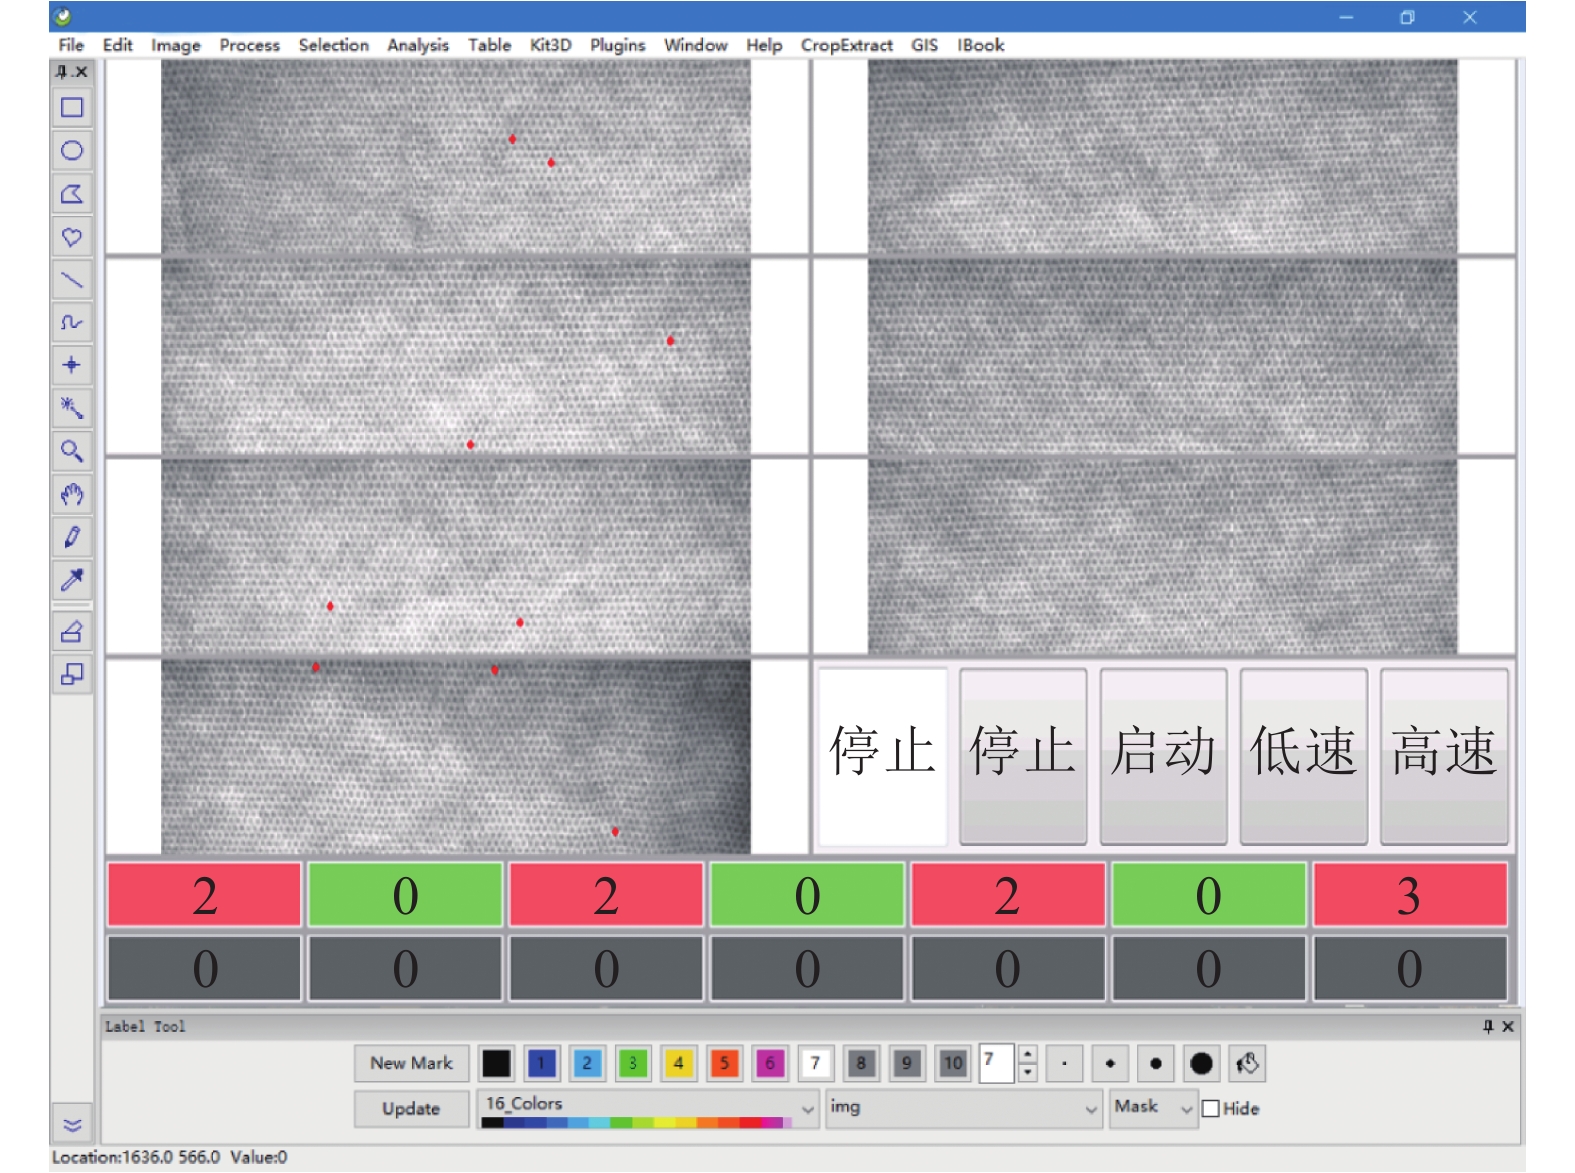
图 1 无纺布生产过程中产生的瑕疵, 第1行为点状疵点, 第2行为丝状瑕疵
Fig. 1 Defects generated in the production process of non-woven fabrics. The dotted defects and filamentary defects are shown in the first and second row
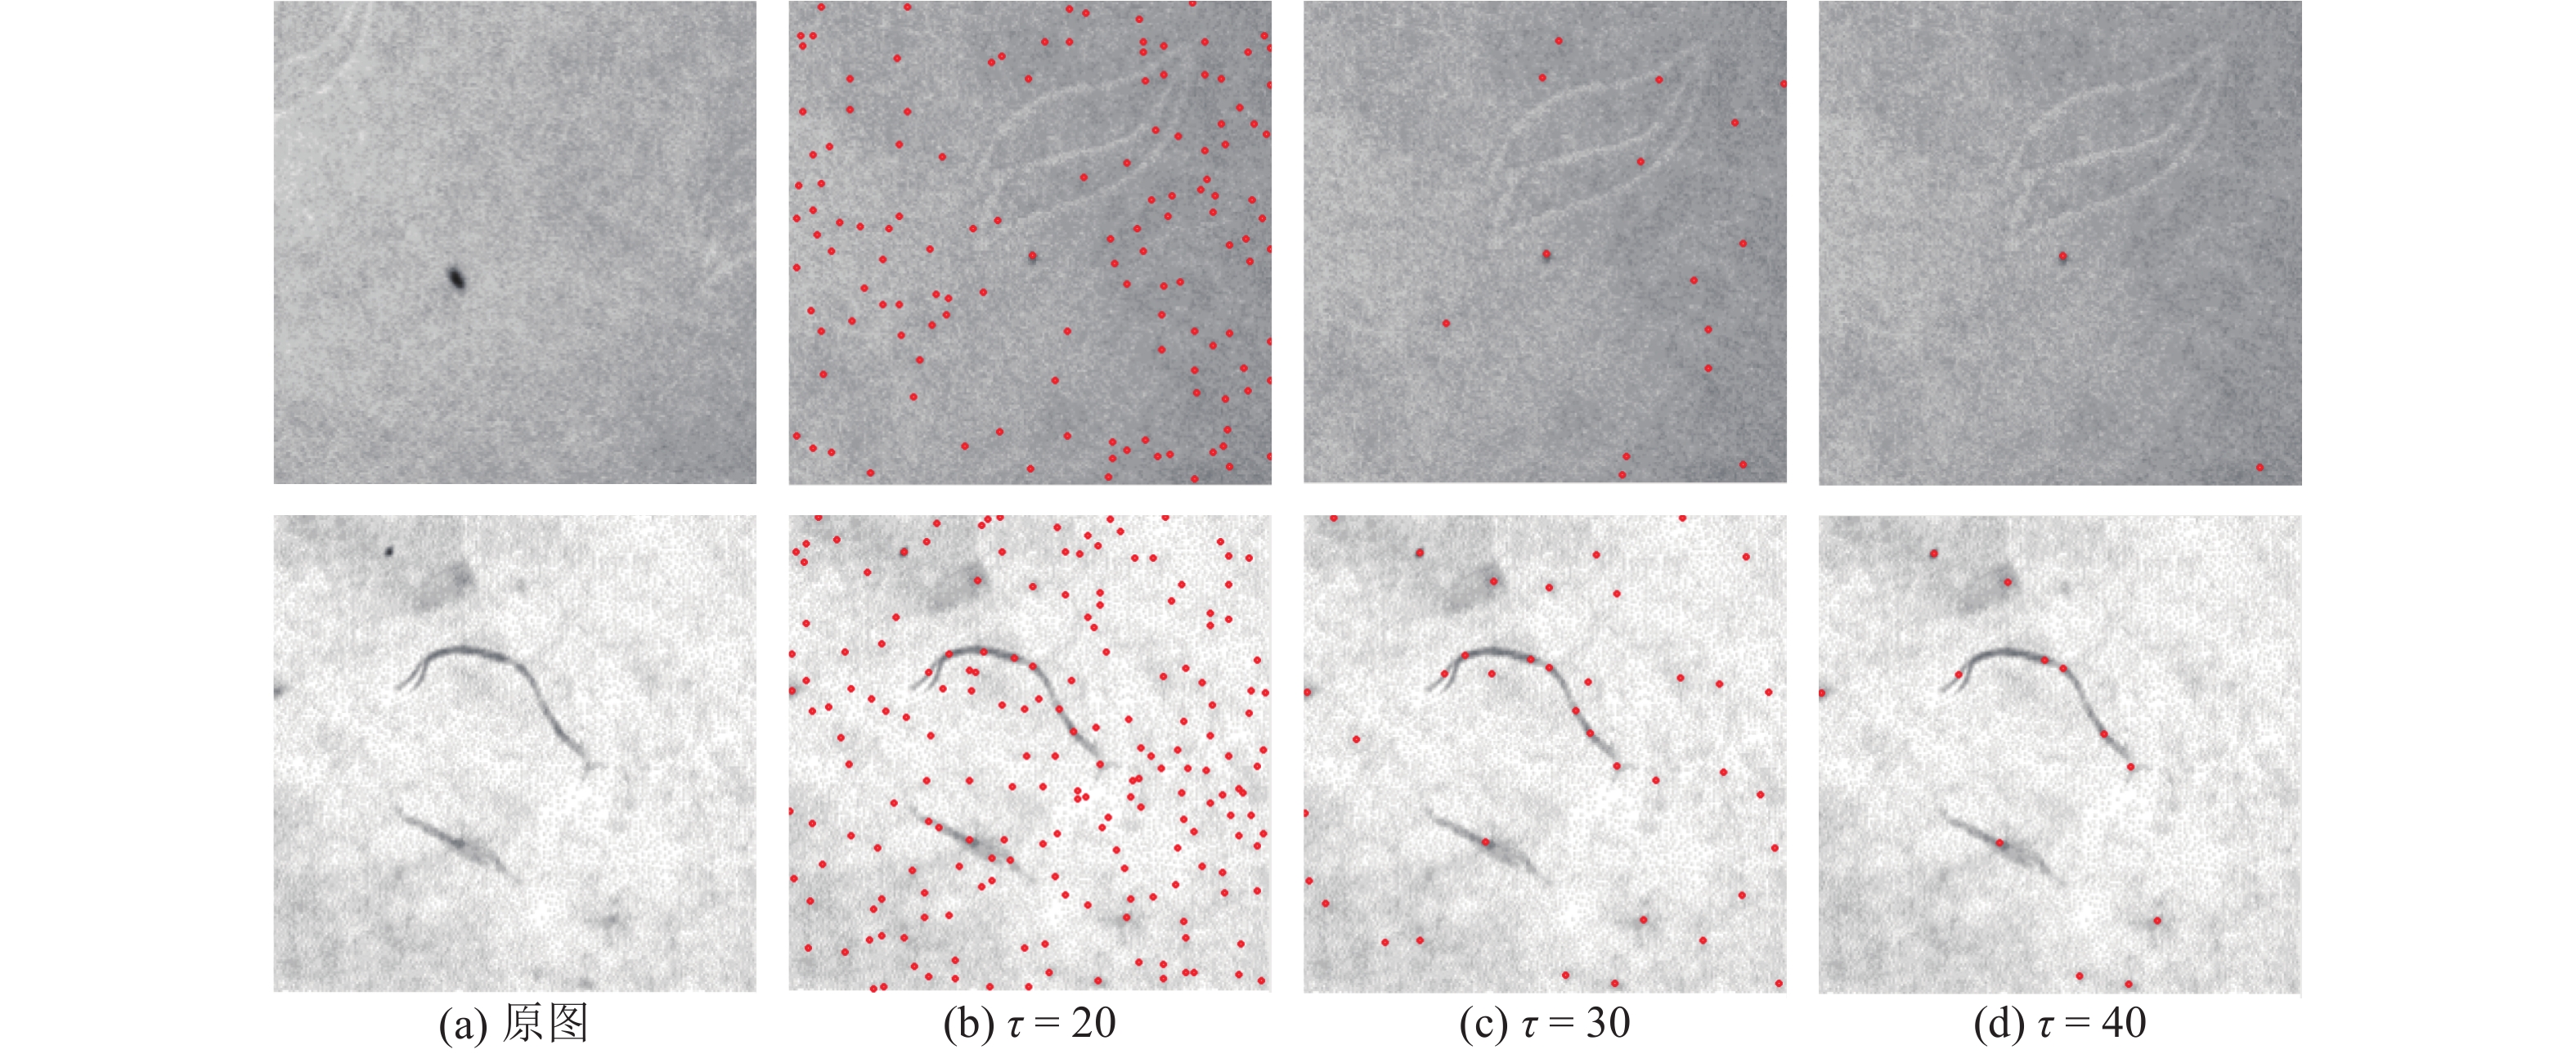
图 2 在不同阈值
$\tau $ 时MSER算法产生的候选区域, 图中点代表候选区域的中心Fig. 2 In the candidate regions generated by the MSER algorithm at different thresholds
$\tau,$ the dots represent the center position of the candidate region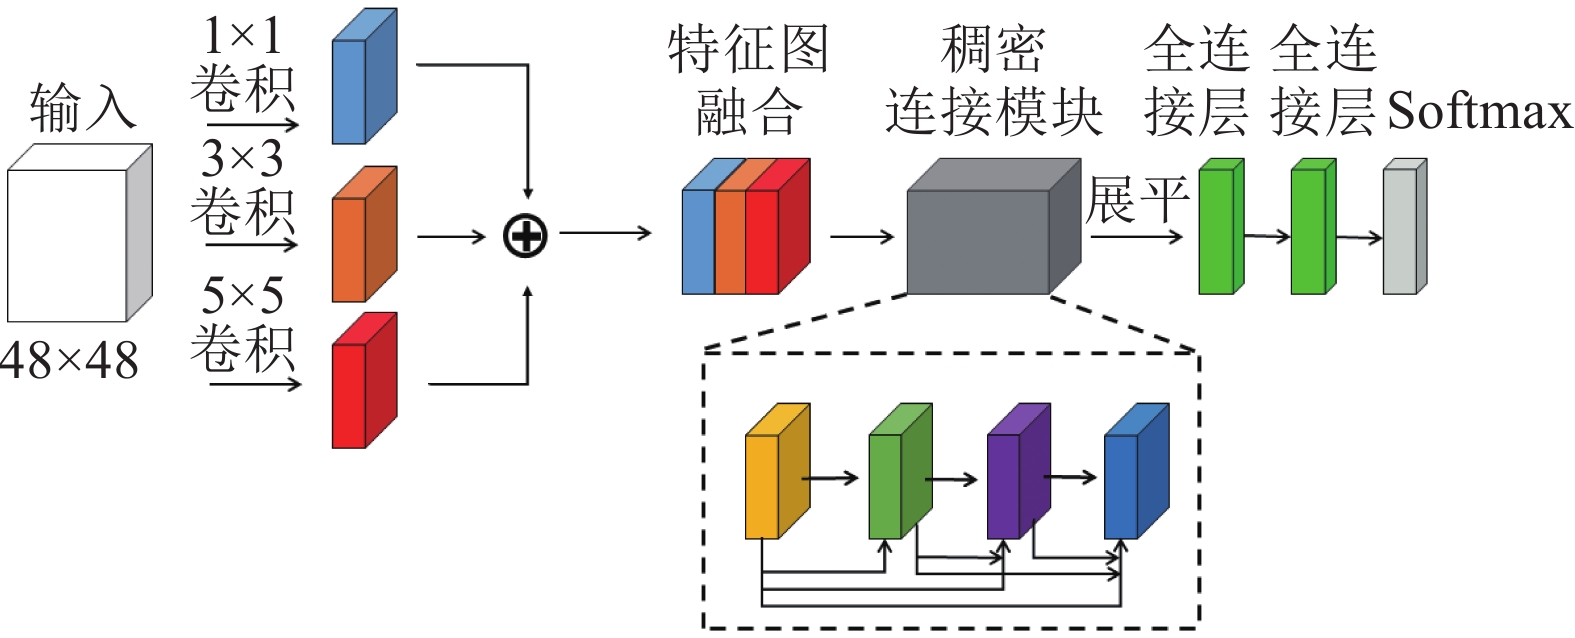
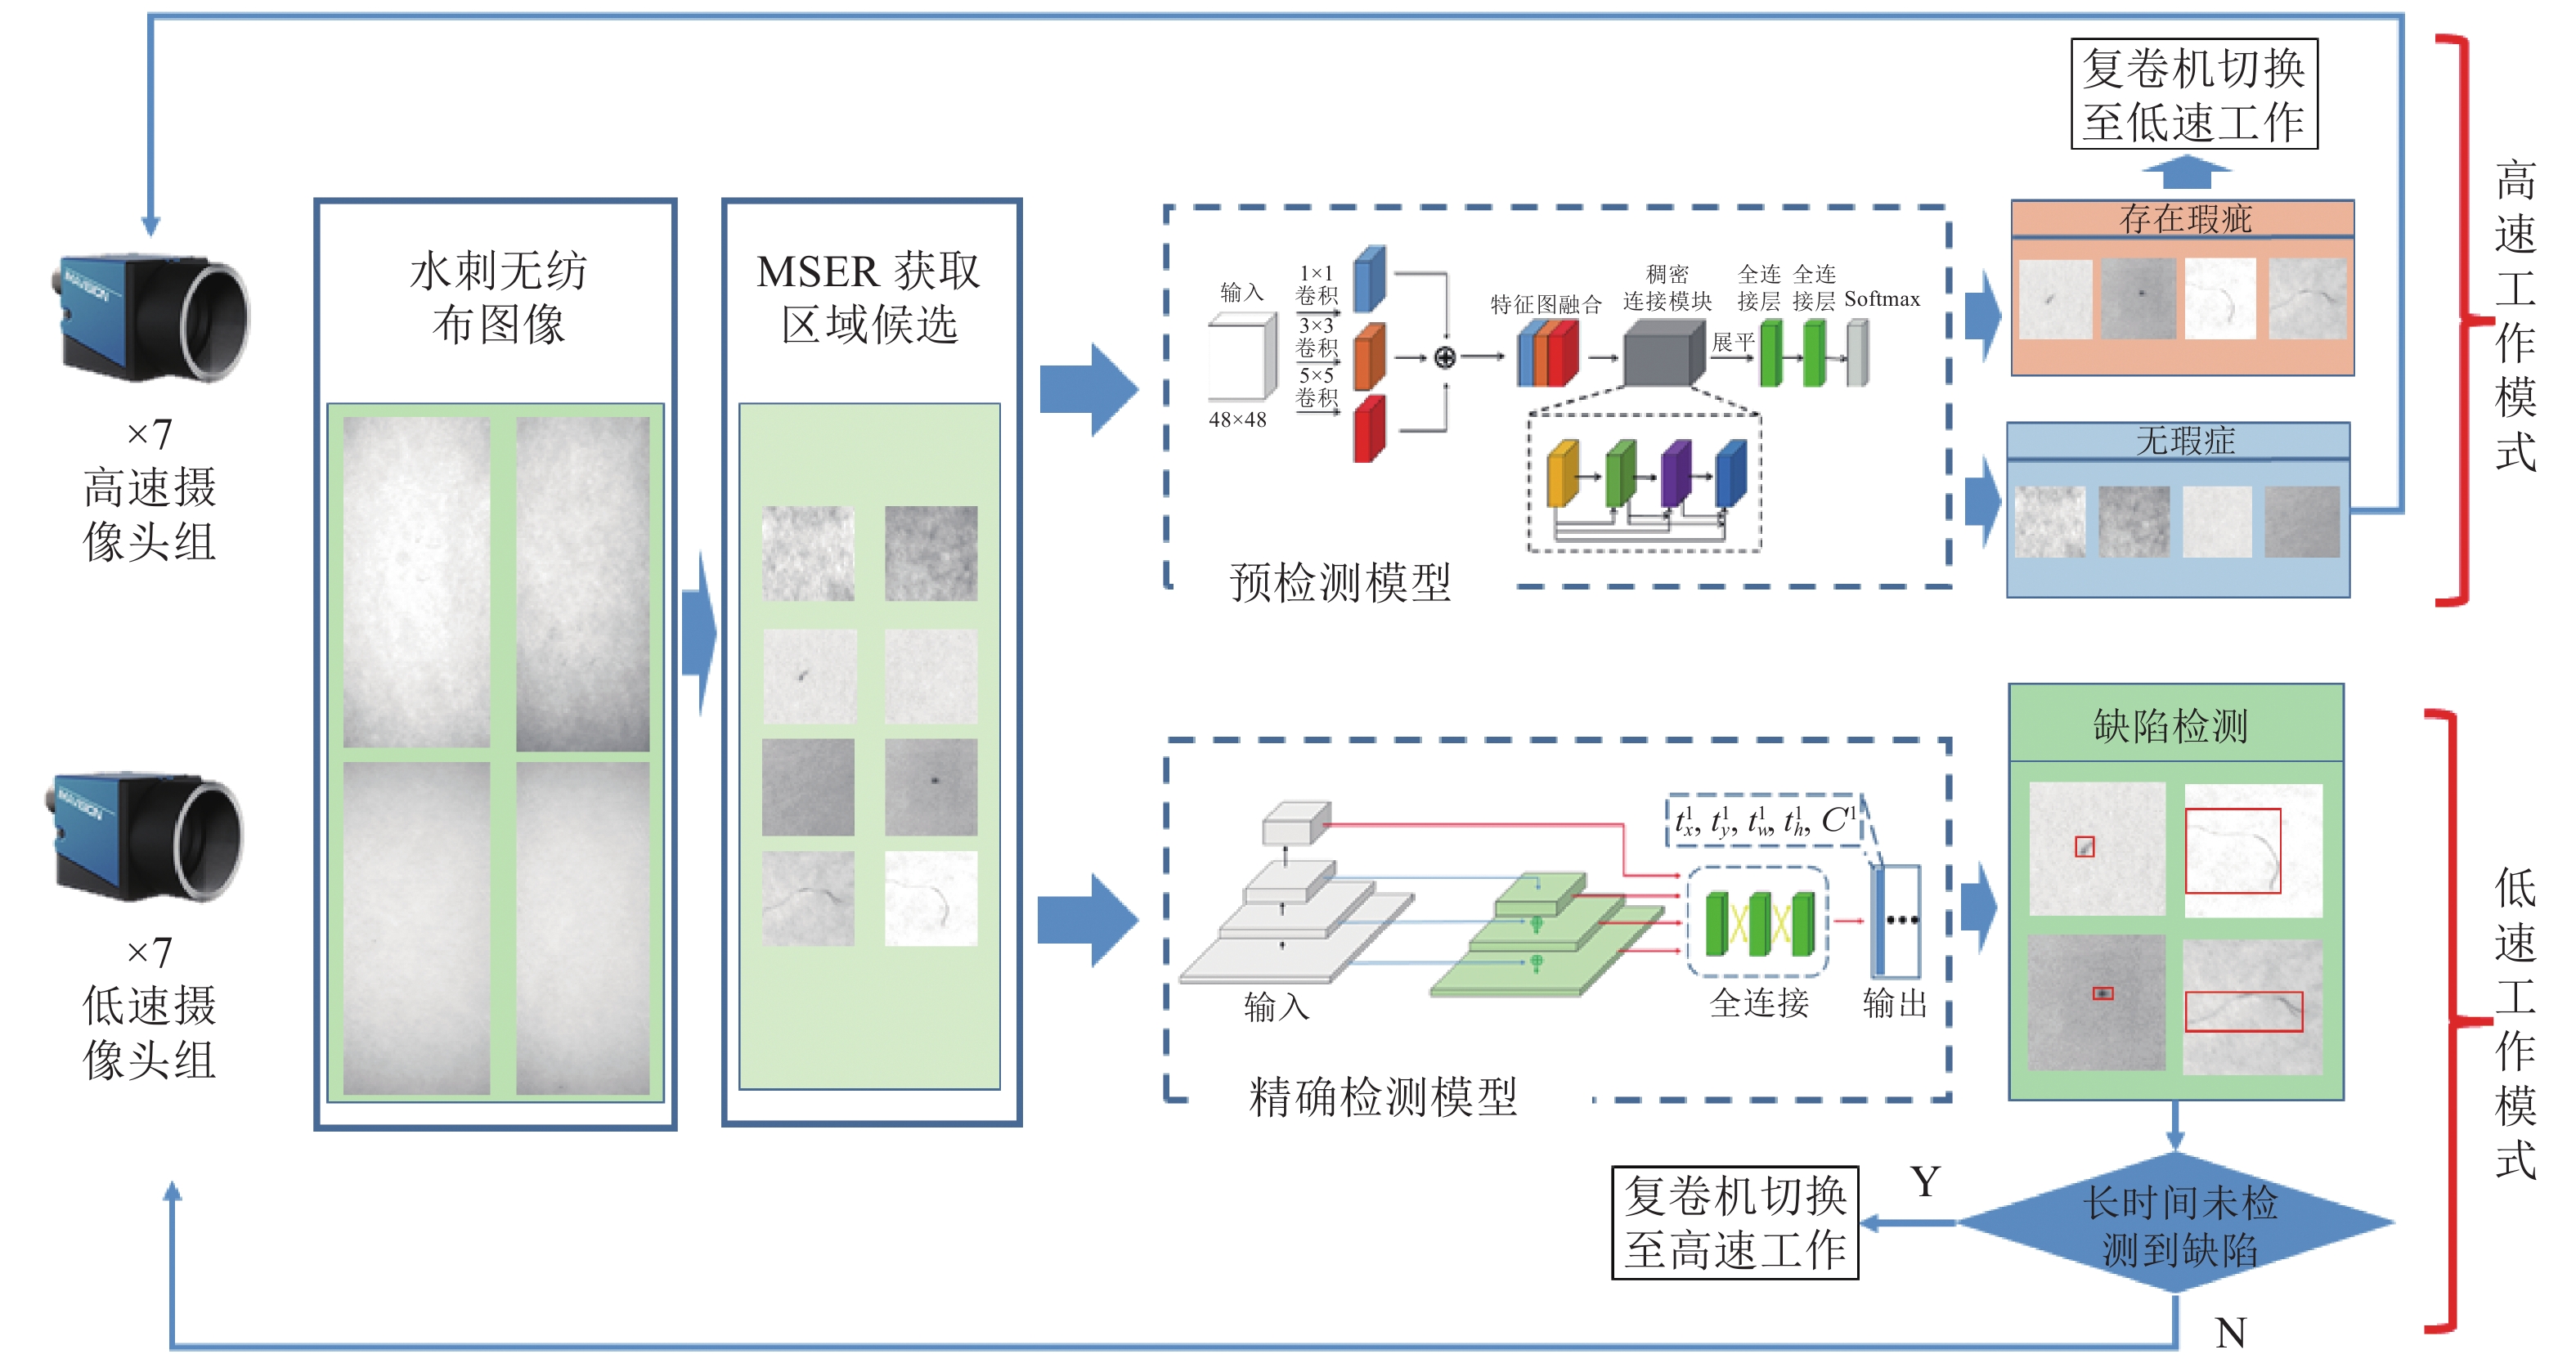
图 3 本文采用的预检测模型结构图. 输入疵点图像经过三个不同尺度的卷积后得到三个特征图, 特征图拼接后作为稠密连接模块的输入. 稠密连接模块输出与全连接层和softmax层相连. 其中虚线矩形框出部分为展开稠密连接模块的具体形式
Fig. 3 The structure diagram of the pre-detection model used in this paper. The input defect image is convolved at three different scales to obtain three feature maps, and the feature maps are concatenated as the input of the dense block. The output of the dense block is connected to the fully connected layer and the softmax layer. Among them. The dashed rectangle outlines the specific form of the dense block
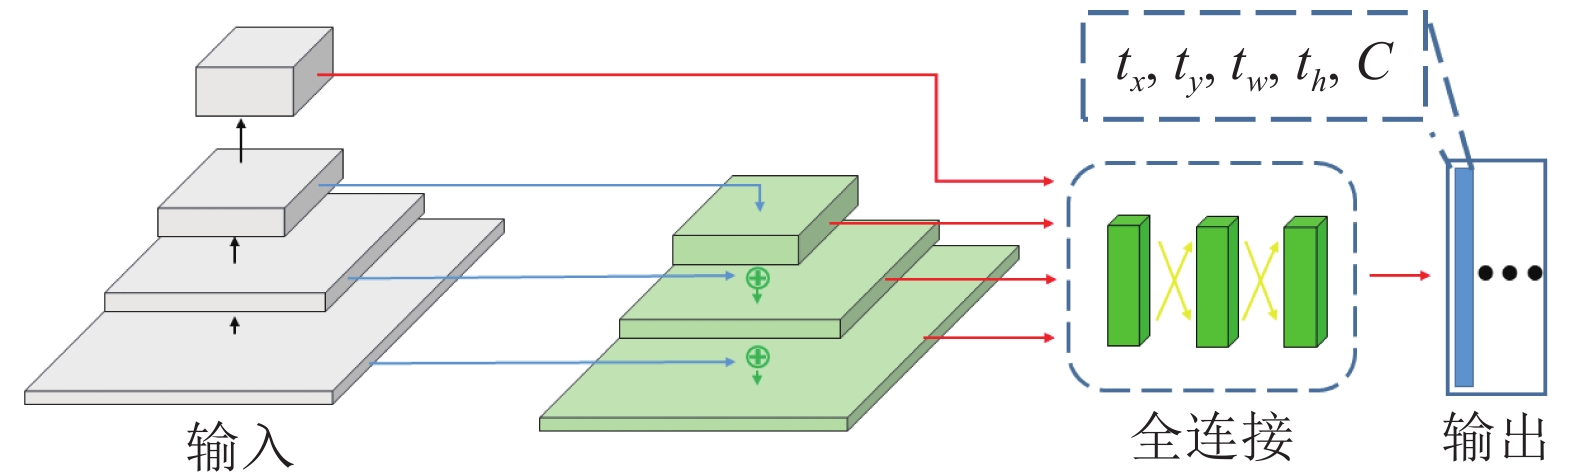
图 4 本文采用的精确检测模型. 其中
${t_x},{t_y},{t_w},{t_h}$ 分别表示检测矩形框的横坐标、纵坐标、宽度与高度,${{C}}$ 表示疵点检测置信度Fig. 4 The precise detection model used in this paper.
${t_x},{t_y},{t_w},{t_h}$ are the abscissa, ordinate, width and height of the detection rectangle, and${{C}}$ is the confidence of defect detection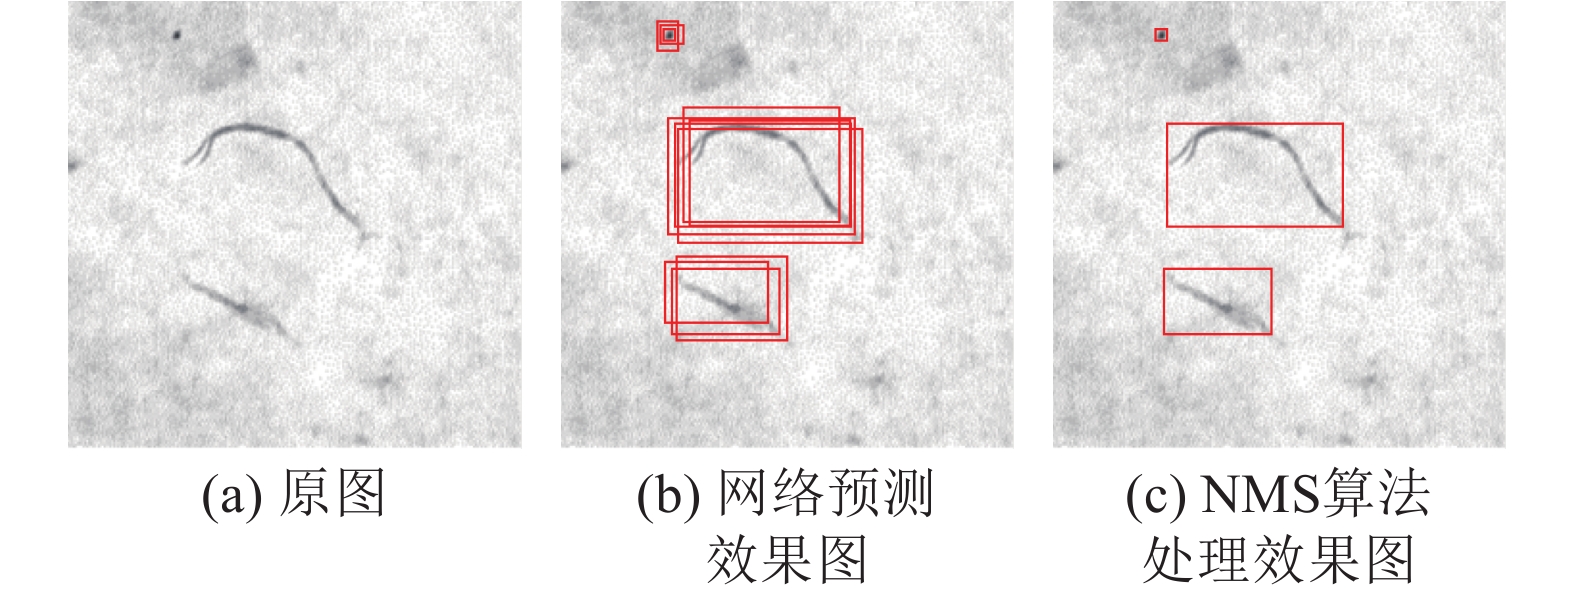
图 5 NMS算法处理效果图
Fig. 5 NMS algorithm processing effect diagram. (a) is the original image; (b) is the network prediction effect diagram, the network prediction rectangle is drawn with a red rectangle; and (c) is the effect diagram processed by the NMS algorithm.
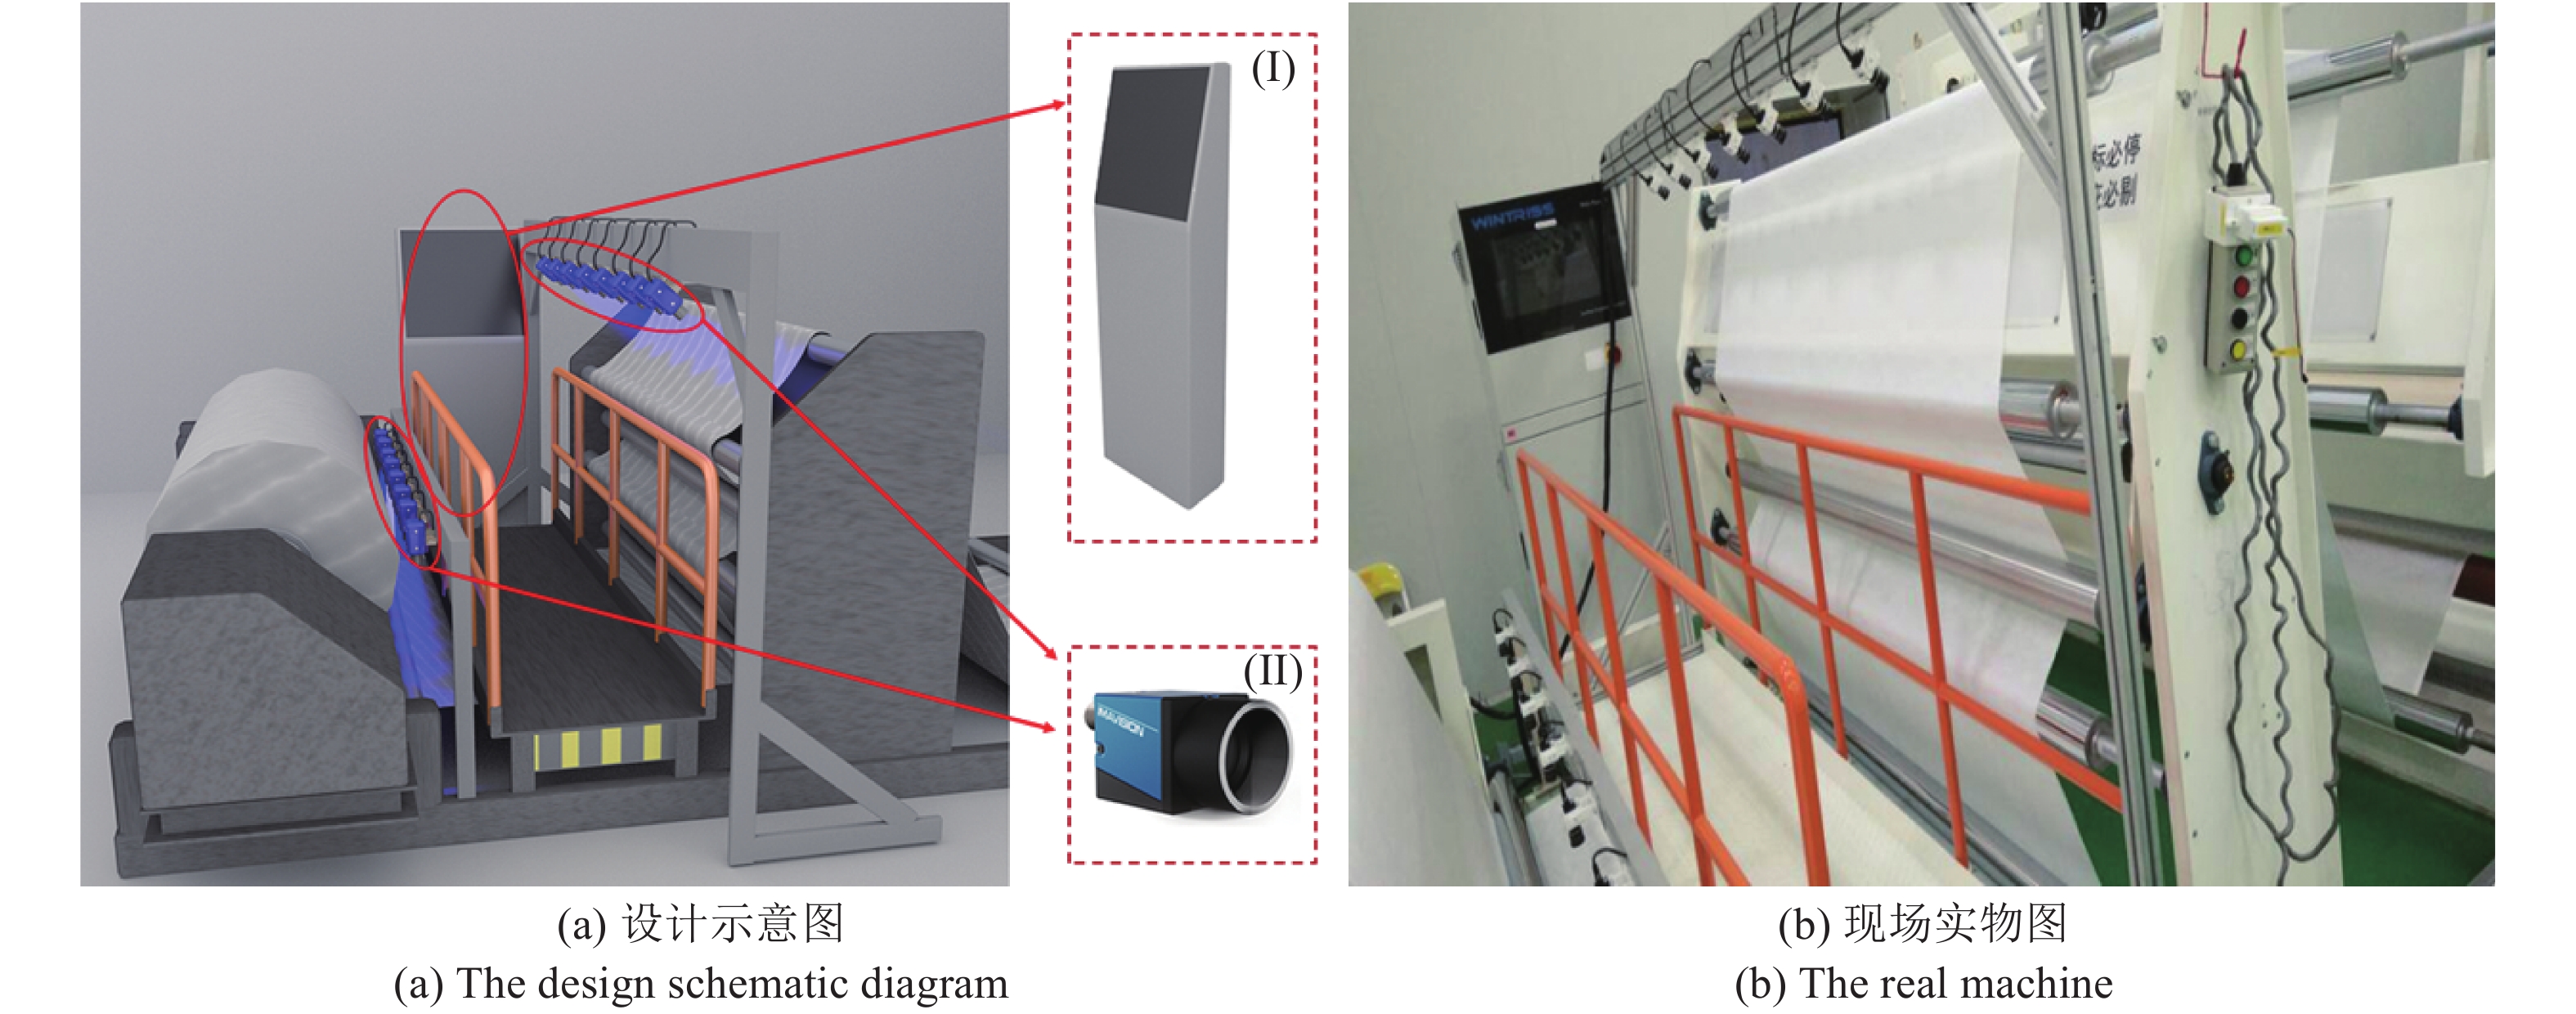
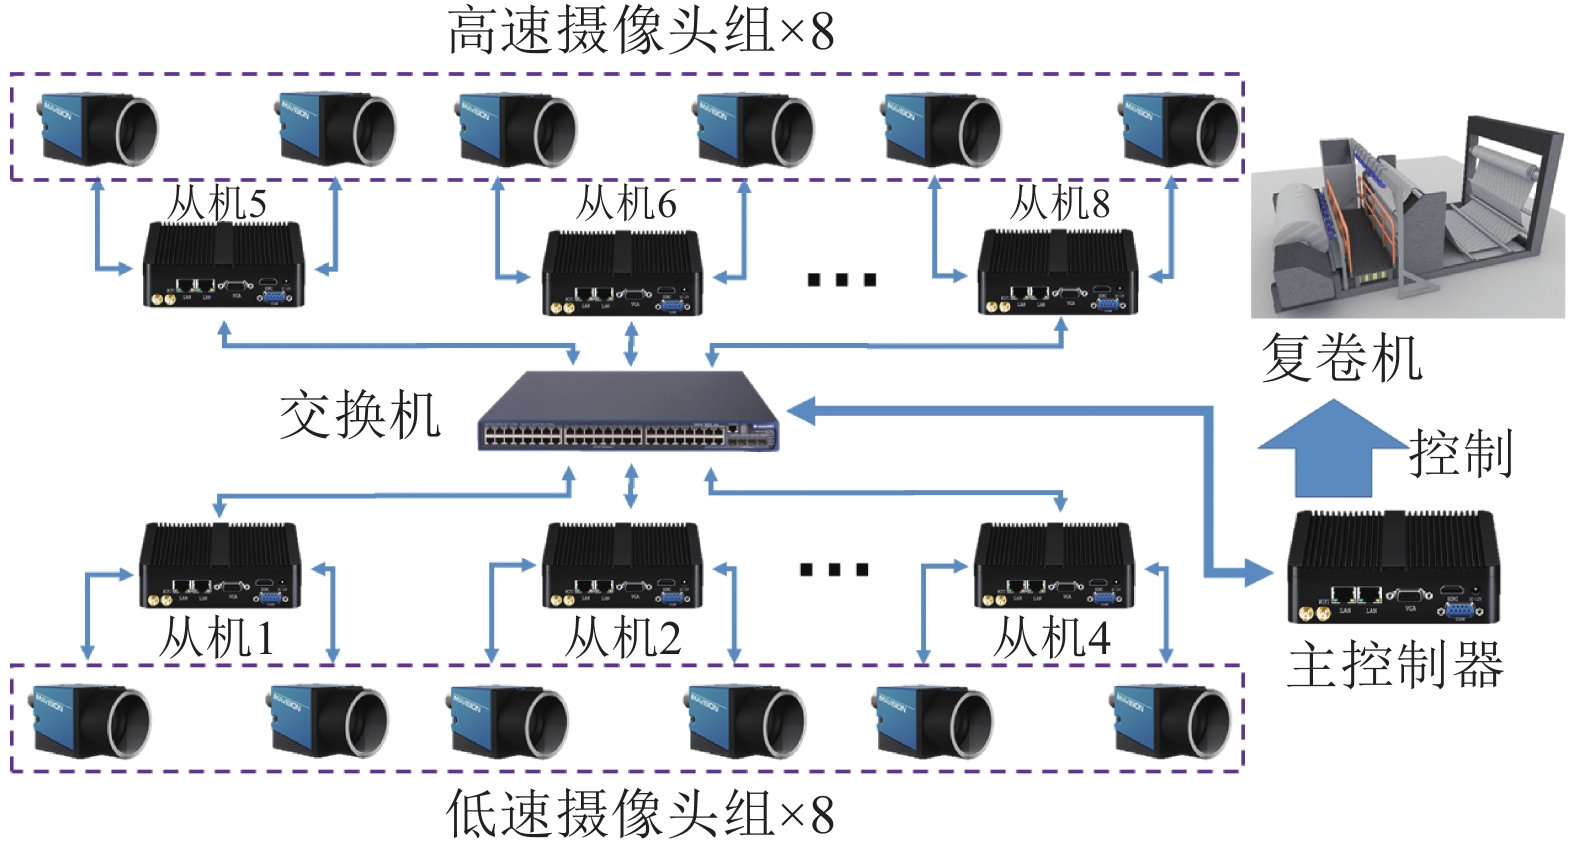
图 7 无纺布疵点检测系统总体组成. (I) 代表工业控制机集群, (II) 代表高速工业摄 像头, 摄像头发出的光线代表摄像头的视野. 下方的摄像头组用于预检测, 上方的摄像头组用于精确检测
Fig. 7 The overall composition of the non-woven defect detection system. In the design diagram (I) represents the industrial control machine cluster, (II) represents the high-peed industrial camera, and the light from the camera represents the camera's field of view. The lower camera group is used for pre-detection, and the upper camera group is used for precise detection
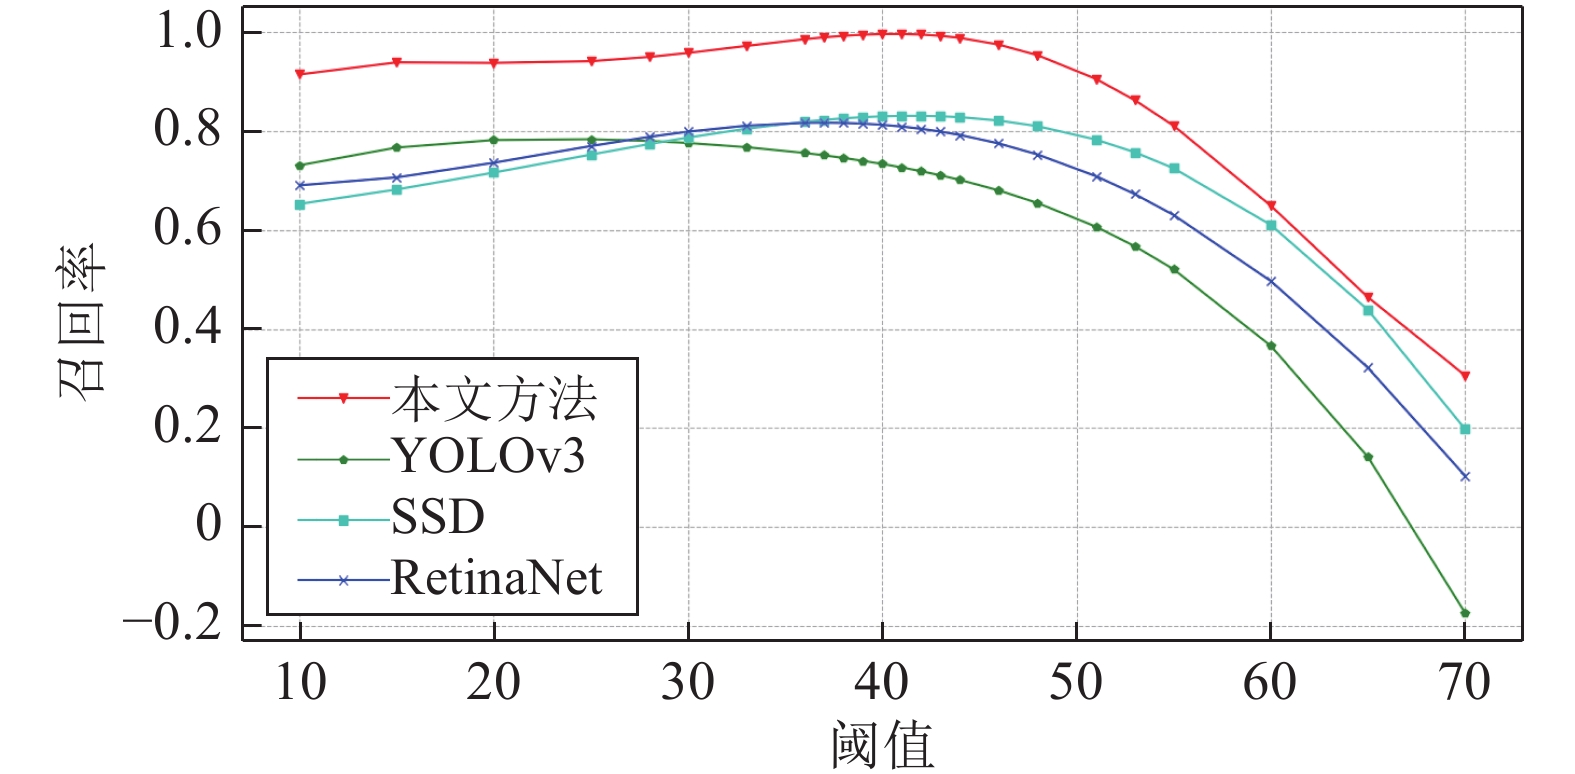
图 12 不同模型在不同阈值
$\tau $ 下的召回率对比Fig. 12 Comparison of recall rates of different models under different thresholds
$\tau $ 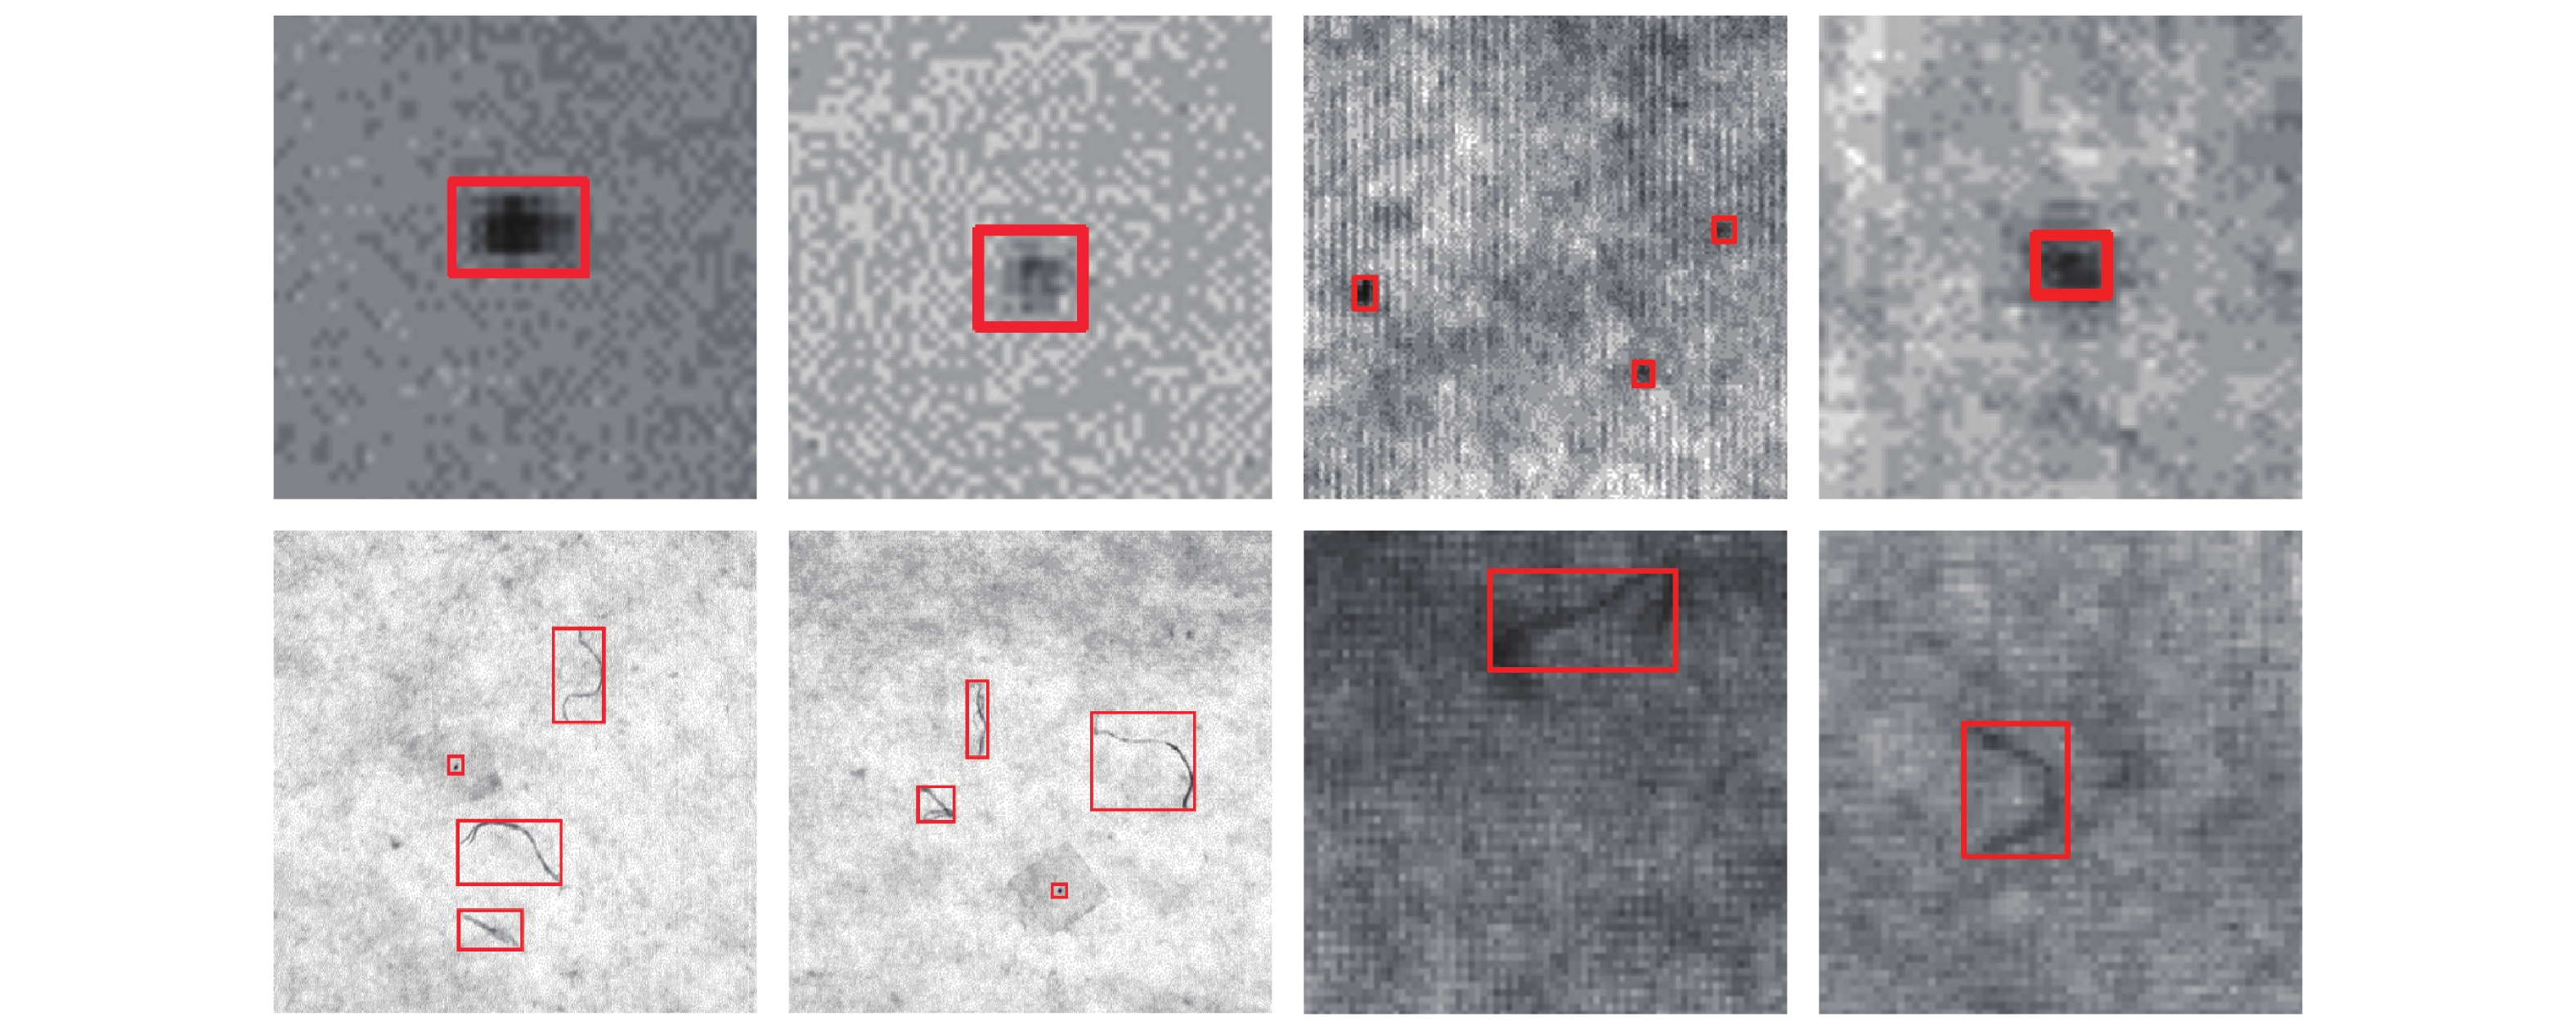
图 10 通过本文算法对疵点进行检测的结果
Fig. 10 The result of defect detection through the algorithm of this paper
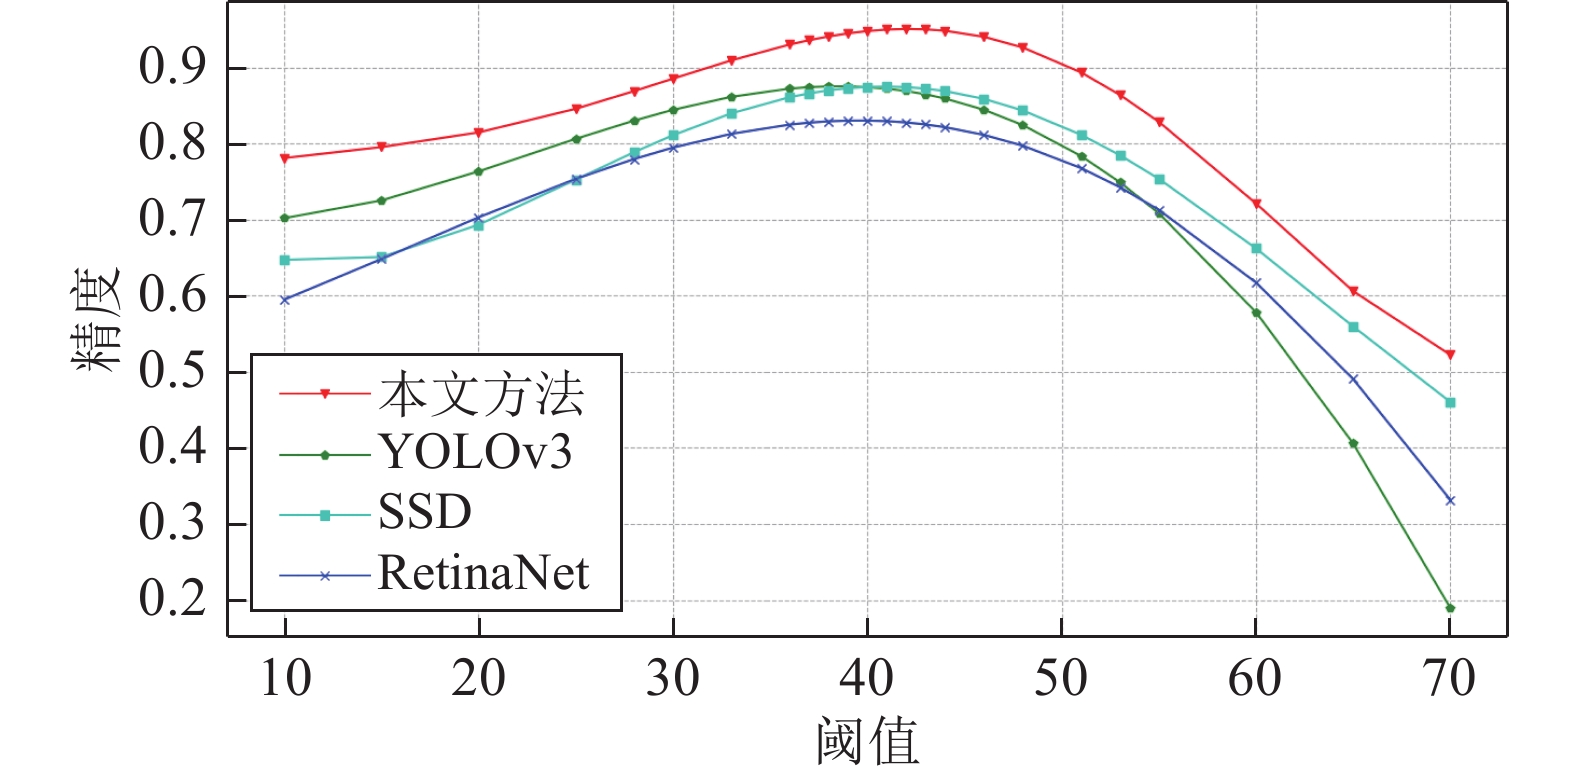
图 11 不同模型在不同阈值
$\tau $ 下的精度对比Fig. 11 Comparison of the accuracy of different models under different thresholds
$\tau $ 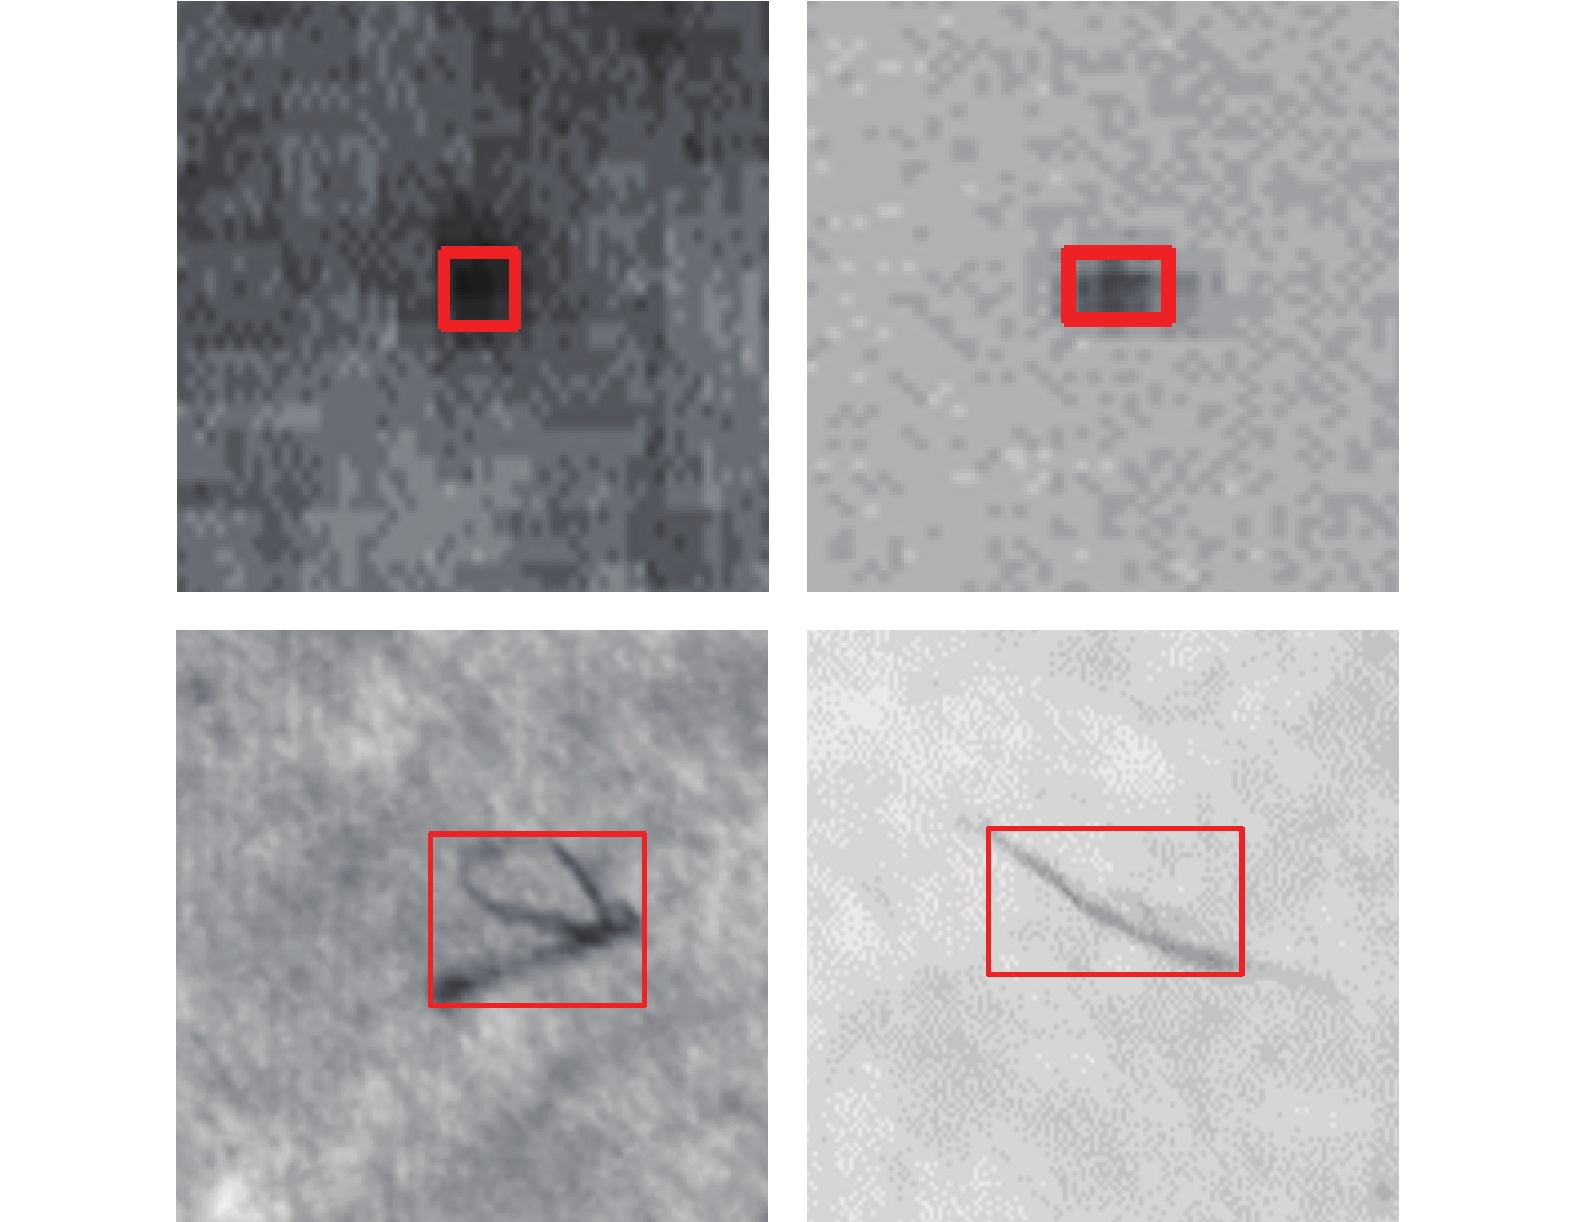
图 13 不同光照和纹理条件下疵点检测结果
Fig. 13 Defect detection results under different lighting and texture conditions
表 1 训练超参数配置
Table 1 Training hyperparameter configuration
参数类型 取值 输入尺寸 48×48 训练轮数 100 学习率 $1{\times 10^{ - 4} }$ 衰减因子 0.99 批次大小 8 优化器 Adam[34]  下载: 导出CSV
表 2 硬件设备参数
Table 2 Hardware device information
硬件类型 参数 摄像头 像素 分辨率 物距 视角 500 w 800 × 600 20 ~ 10 m 75度 控制器 处理器 内存 固态 显卡 i5 8 GB 64 GB Intel HD 交换机 端口数 端口参数 8个 1000 M 自适应 RJ45 端口
下载: 导出CSV
表 3 模型在不同阈值下的检测精度和召回率
Table 3 The detection accuracy and recall rate of the model under different thresholds
模型 阈值 精度(%) 召回率(%) 预检测 $\tau {\rm{ = 20}}$ 73.0 100.0 $\tau {\rm{ = 30}}$ 80.5 100.0 $\tau {\rm{ = 40}}$ 86.4 99.3 精确检测 $\tau {\rm{ = 20}}$ 86.1 100.0 $\tau {\rm{ = 30}}$ 94.5 100.0 $\tau {\rm{ = 40}}$ 98.4 99.7
下载: 导出CSV
表 4 模型预测速度测试 (ms)
Table 4 Model prediction speed test (ms)
模型 48×48 候选区域 2400×600 无纺布图像 预检测 3.2 46.8 精确检测 13.9 213.3
下载: 导出CSV
表 5 不同类型疵点的检测精度和召回率测试
Table 5 Testing accuracy and recall rate of different types of defects
疵点类型 疵点尺寸 (mm) 召回率 (%) 精度 (%) 点状瑕疵 > 0.3 100.0 98.8 0.1 ~ 0.3 99.6 98.3 丝状瑕疵 > 0.1 98.8 98.6 0.05 ~ 0.1 96.8 97.2
下载: 导出CSV
-
[1] 周树照. 论无纺布的现状及发展. 山东工业技术, 2017, (20): 273Zhou Shu-Zhao. On the status quo and development of non-woven fabrics. Shan-dong Industrial Technology, 2017, (20): 273 [2] De Baar H J W. von Liebig′s law of the minimum and plankton ecology (1899−1991). Progress in Oceanography, 1994, 33(4): 347−386 doi: 10.1016/0079-6611(94)90022-1 [3] 陶显, 侯伟, 徐德. 基于深度学习的表面缺陷检测方法综述. 自动化学报, 2020: 1−19Tao Xian, Hou Wei, Xu De. A survey of surface defect detection methods based on deep learning. Acta Automatica Sinica, 2020: 1−19 [4] 刘伟斌, 郑力新, 周凯汀. 采用频域滤波的织物疵点检测方法. 华侨大学学报(自然科学版), 2017, 38(4): 562−566Liu Wei-Bin, Zheng Li-Xin, Zhou Kai-Ting. Detection method of fabric defects based on frequency domain filtering. Journal of Huaqiao University (Natural Science), 2017, 38(4): 562−566 [5] 杨亚, 薛云灿, 沙伟, 吉玲. 基于正交小波分解的织物疵点检测. 微处理机, 2015, 36(3): 46−49, 53 doi: 10.3969/j.issn.1002-2279.2015.03.014Yang Ya, Xue Yun-Can, Sha Wei, Ji Ling. Fabric defect detection based on orthonor-mal wavelet decomposition. Microprocessors, 2015, 36(3): 46−49, 53 doi: 10.3969/j.issn.1002-2279.2015.03.014 [6] 曹媛媛, 杨波, 徐光祐. 基于分形纹理特征和小波变换的网状纹理检测方法. 自动化学报, 2007, 33(7): 688−692Cao Yuan-Yuan, Yang Bo, Xu Guang-You. Netlike texture detection method using fractal texture features and wavelet transform. Acta Automatica Sinica, 2007, 33(7): 688−692 [7] 吴秀永, 徐科, 徐金梧. 基于Gabor小波和核保局投影算法的表面缺陷自动识别方法. 自动化学报, 2010, 36(3): 438−441 doi: 10.3724/SP.J.1004.2010.00438Wu Xiu-Yong, Xu Ke, Xu Jin-Wu. Automatic recognition method of surface defects based on Gabor wavelet and kernel locality preserving projections. Acta Automatica Sinica, 2010, 36(3): 438−441 doi: 10.3724/SP.J.1004.2010.00438 [8] 王传桐, 胡峰, 徐启永, 吴雨川, 余联庆. 采用Gabor滤波簇和等距映射算法的织物疵点检测方法. 纺织学报, 2017, 38(3): 162−167Wang Chuan-Tong, Hu Feng, Xu Qi-Yong, Wu Yu-Chuan, Yu Lian-Qing. Detection of fabric defects based on Gabor filters and Isomap. Journal of Textile Research, 2017, 38(3): 162−167 [9] 孙君顶, 李欣, 盛娜, 毋小省. 基于MBLBPV算法的布匹瑕疵检测方法. 测控技术, 2019, 38(1): 71−76Sun Jun-Ding, Li Xin, Sheng Na, Wu Xiao-Sheng. Fabric defect detection based on multi-scale block local binary patterns variance. Measurement and Control Technology, 2019, 38(1): 71−76 [10] 张沐光, 宋执环. LPMVP算法及其在故障检测中的应用. 自动化学报, 2009, 35(6): 766−772 doi: 10.3724/SP.J.1004.2009.00766Zhang Mu-Guang, Song Zhi-Huan. LPMVP algorithm and its application to fault detection. Acta Automatica Sinica, 2009, 35(6): 766−772 doi: 10.3724/SP.J.1004.2009.00766 [11] 董蓉, 李勃, 徐晨. 应用积分图的织物瑕疵检测快速算法. 纺织学报, 2016, 37(11): 141−147Dong Rong, Li Bo, Xu Chen. Fast fabric defect detection algorithm based on integral image. Journal of Textile Research, 2016, 37(11): 141−147 [12] 杨晓波. 基于GMRF模型的统计特征畸变织物疵点识别. 纺织学报, 2013, 34(4): 137−142 doi: 10.3969/j.issn.0253-9721.2013.04.027Yang Xiao-Bo. Fabric defect detection of statistic aberration feature based on GMRF model. Journal of Textile Research, 2013, 34(4): 137−142 doi: 10.3969/j.issn.0253-9721.2013.04.027 [13] 王孟涛, 李岳阳, 杜帅. 基于机器视觉的疵点检测方法的研究进展. 现代纺织技术, 2019, 27(5): 57−61Wang Meng-Tao, Li Yue-Yang, Du Shuai. Research progress of defect detection method based on machine vision. Advanced Textile Technology, 2019, 27(5): 57−61 [14] Zhao Y D, Hao K R, He H B, Tang X S, Wei B. A visual long-short-term memory based integrated CNN model for fabric defect image classification. Neurocomputing, 2020, 380: 259−270 doi: 10.1016/j.neucom.2019.10.067 [15] 李良福, 马卫飞, 李丽, 陆铖. 基于深度学习的桥梁裂缝检测算法研究. 自动化学报, 2019, 45(9): 1727−1742Li Liang-Fu, Ma Wei-Fei, Li Li, Lu Cheng. Research on detection algorithm for bridge cracks based on deep learning. Acta Automatica Sinica, 2019, 45(9): 1727−1742 [16] 金侠挺, 王耀南, 张辉, 刘理, 钟杭, 贺振东. 基于贝叶斯CNN和注意力网络的钢轨表面缺陷检测系统. 自动化学报, 2019, 45(12): 2312−2327Jin Xia-Ting, Wang Yao-Nan, Zhang Hui, Liu Li, Zhong Hang, He Zhen-Dong. DeepRail: Automatic visual detection system for railway surface defect using Bayesian CNN and attention network. Acta Automatica Sinica, 2019, 45(12): 2312−2327 [17] DAGM 2007 Datasets [Online], available: https://hci.iwr.uni-heidelberg.de/node/3616, February 27, 2018. [18] Kampouris C, Zafeiriou S, Ghosh A, Malassiotis S. Fine-grained material classifica-tion using micro-geometry and reflectance. In: Proceedings of the 14th European Conference on Computer Vision. Cham, Switzerland: Springer, 2016. 778−792 [19] Kylberg G. Kylberg Texture Dataset v.1.0. Centre for Image Analysis, Swedish University of Agricultural Sciences and Uppsala University, 2011. [20] Çelik H I, Dülger L C, Topalbekiroğlu M. Development of a machine vision system: Real-time fabric defect detection and classification with neural networks. The Journal of the Textile Institute, 2014, 105(6): 575−585 doi: 10.1080/00405000.2013.827393 [21] 车翔玖, 刘华罗, 邵庆彬. 基于Fast RCNN改进的布匹瑕疵识别算法. 吉林大学学报(工学版), 2019, 49(6): 2038−2044Che Xiang-Jiu, Liu Hua-Luo, Shao Qing-Bin. Fabric defect recognition algorithm based on improved Fast RCNN. Journal of Jilin University (Engineering and Technology Edition), 2019, 49(6): 2038−2044 [22] Liu Z F, Liu X H, Li C L, Li B C, Wang B R. Fabric defect detection based on faster R-CNN. In: Proceedings of the 9th International Conference on Graphic and Image Processing. Qingdao, China: SPIE, 2018. 106150A [23] 邵鑫玉, 华继钊. 基于机器视觉的无纺布缺陷自动检测系统. 计算机科学, 2014, 41(S1): 487−489Shao Xin-Yu, Hua Ji-Zhao. Automatic detection system of fabric defects based on machine vision. Computer Science, 2014, 41(S1): 487−489 [24] 李明, 景军锋, 李鹏飞. 应用GAN和Faster R-CNN的色织物缺陷识别. 西安工程大学学报, 2018, 32(6): 663−669Li Ming, Jing Jun-Feng, Li Peng-Fei. Yarn-dyed fabric defect detection based on GAN and faster R-CNN. Journal of Xi' an Polytechnic University, 2018, 32(6): 663−669 [25] Matas J, Chum O, Urban M, Pajdla T. Robust wide-baseline stereo from maximally stable extremal regions. Image and Vision Computing, 2004, 22(10): 761−767 doi: 10.1016/j.imavis.2004.02.006 [26] 贺智明, 彭亚楠. 基于深度学习的织物疵点检测研究进展. 毛纺科技, 2019, 47(8): 83−88He Zhi-Ming, Peng Ya-Nan. Progress in fabric defect detection based on deep learn-ing. Wool Textile Journal, 2019, 47(8): 83−88 [27] Huang G, Liu Z, Van Der Maaten L, Weinberger K Q. Densely connected convolu-tional networks. In: Proceedings of the 2017 IEEE Conference on Computer Vision and Pattern Recognition. Honolulu, USA: IEEE, 2017. 4700−4708 [28] Deng J K, Guo J, Zhou Y X, Yu J K, Kotsia I, Zafeiriou S. RetinaFace: Single-stage dense face localisation in the wild. arXiv preprint arXiv: 1905.00641, 2019. [29] Lin T Y, Dollár P, Girshick R, He K M, Hariharan B, Belongie S. Feature pyramid networks for object detec-tion. In: Proceedings of the 2017 IEEE Conference on Computer Vision and Pattern Recognition. Honolulu, USA: IEEE, 2017: 2117−2125 [30] Redmon J, Farhadi A. YOLOv3: An incremental improvement. arXiv preprint arXiv: 1804.02767, 2018. [31] Zhou D F, Fang J, Song X B, Guan C Y, Yin J B, Dai Y C, et al. IoU loss for 2D/3D object detection. In: Proceedings of the 2019 International Conference on 3D Vision. Québec City, Canada: IEEE, 2019. 85−94 [32] Zheng Z H, Wang P, Liu W, Li J Z, Ye R G, Ren D W. Distance-IoU loss: Faster and better learning for bounding box regression. Proceedings of the AAAI Conference on Artificial Intelligence, 2020, 34(7): 12993−13000 doi: 10.1609/aaai.v34i07.6999 [33] 童艳, 孙君亮, 王鹏宇. 实时测控数据处理集群软件测试系统设计. 自动化技术与应用, 2019, 38(6): 50−53 doi: 10.3969/j.issn.1003-7241.2019.06.011Tong Yan, Sun Jun-Liang, Wang Peng-Yu. Design of test system for real-time meas-urement and control data processing cluster. Techniques of Automation and Applications, 2019, 38(6): 50−53 doi: 10.3969/j.issn.1003-7241.2019.06.011 [34] Kingma D P, Ba J. Adam: A method for stochastic optimization. arXiv preprint arXiv: 1412.6980, 2014. [35] Liu W, Anguelov D, Erhan D, Szegedy C, Reed S, Fu C Y, et al. SSD: Single shot MultiBox detector. In: Proceedings of the 14th European Conference on Computer Vision. Cham, Switzerland: Springer, 2016. 21−37 -

 下载:
下载:


计量
- 文章访问数: 1835
- HTML全文浏览量: 817
- PDF下载量: 342
- 被引次数: 0
