

MPC Performance Monitoring and Diagnosis Based on Dissimilarity Analysis of PLS Cross-product Matrix
-
摘要: 针对传统基于输出协方差矩阵的性能监控方法未充分考虑过程变量与输出变量之间的相关性问题,提出一种基于偏最小二乘(Partial least squares,PLS)交叉积矩阵非相似度分析的性能监控与诊断方法,用于多变量模型预测控制(Model predictive control,MPC)系统.首先,考虑模型预测控制系统的控制结构,构造包含预测误差的增广过程变量与输出变量相关性的PLS交叉积矩阵,通过非相似度分析方法将交叉积矩阵的非相似度比较转化为转换矩阵特征值的比较.然后提取转换矩阵中表征最大非相似度的l个特征值构造实时性能指标,对MPC系统进行性能监控.检测到性能下降后,进一步利用转换矩阵的特征值诊断性能恶化源.Wood-Berry二元精馏塔上的仿真结果表明,所提方法能够有效地提高监控性能,并准确地定位性能恶化源.Abstract: Performance monitoring methods for control systems based on output covariance matrix can not sufficiently exploit the correlation between the process variables and output variables. To solve this problem, a performance monitoring and diagnosis method based on dissimilarity analysis of partial least squares (PLS) cross-product matrix is proposed for multivariate model predictive control (MPC) systems. Firstly, the PLS cross-product matrix, which contains the correlation information of augmented process variables and output variables, is constructed. And dissimilarity analysis is carried out to transform dissimilarity comparison of cross-product matrixes to eigenvalue comparison of transformed matrixes. Then, using the l eigenvalues, which include the maximum dissimilarity information, a new performance index is constructed to monitor the performance of MPC system. Finally, the index is further improved to meet the requirement of diagnosing the root cause of performance deterioration. Simulation results on the Wood-Berry binary distillation column demonstrate that the proposed method can effectively enhance the monitoring performance and accurately locate the source of performance deterioration.1) 本文责任编委 钟麦英
-
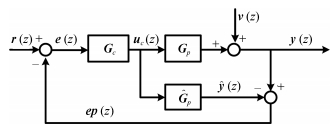
图 1 模型预测控制系统内模结构
Fig. 1 Schematic diagram of the internal model control structure for model predictive control
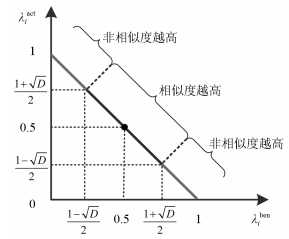
图 2 转换矩阵特征值分布示意图
Fig. 2 Distribution diagram of the eigenvalues of transformed matrixes
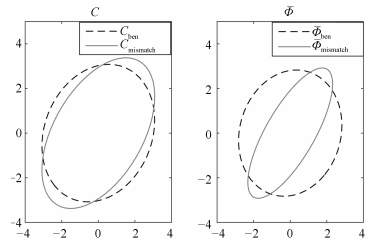
图 3 模型失配时矩阵C与矩阵$\bar { {\varPhi}}$所构成的椭圆
Fig. 3 Ellipses figure formed by matrices C and $\bar{\varPhi}$ with model mismatch
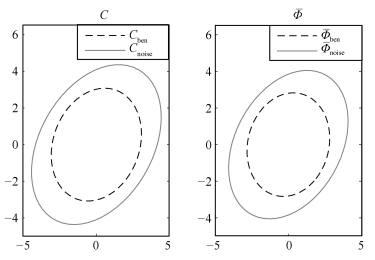
图 5 干扰特征变化时矩阵C与矩阵$\bar { {\varPhi}}$所构成的椭圆
Fig. 5 Ellipses figure formed by matrices C and $\bar { {\varPhi}}$ with changing disturbance
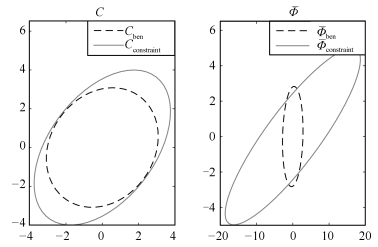
图 7 约束饱和时矩阵C与矩阵$\bar { {\varPhi}}$所构成的椭圆
Fig. 7 Ellipses figure formed by matrices C and $\bar { {\varPhi}}$ with output constraint saturation
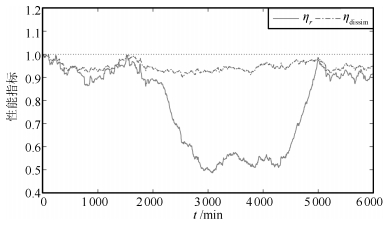
图 9 较小模型失配程度下的实时监控曲线
Fig. 9 Real-time monitoring curves under small extent of model mismatch
表 1 恶化性能类别及参数设置
Table 1 Classes and parameters of performance deterioration
模式库 工况 相应参数 参数变化 $\rm {CL}_1$ 过程模型失配 首行增益 $(12.8, {\rm{ \ -}}18.9)\to (25.6, {\rm{ }} \ -37.8)$ $\rm {CL}_2$ 干扰特征变化 标准差 $0.1 \to 0.13$ $\rm {CL}_3$ 输出约束饱和 输出约束 无$\to [-0.65 \ \ {\rm{ + }}0.65]$  下载: 导出CSV
表 2 不同程度模型失配下的性能指标
Table 2 Performance under different degree of model mismatch
过程传函矩阵首行增益 $\eta _{\det }$ $\eta_{\rm dissim}$ $\eta_{ r}$ (20.48, -30.24) 0.9475 0.8547 0.4142 (23.04, -34.02) 1.0035 0.8374 0.3890 (25.60, -37.80) 1.0573 0.8217 0.3698 (28.16, -41.58) 1.1092 0.8075 0.3542 (30.72, -45.36) 1.1589 0.7948 0.3413
下载: 导出CSV
表 3 不同干扰标准差下的性能指标
Table 3 Performance under different standard deviation of disturbance
标准差 $\eta _{\det }$ $\eta_{\rm dissim}$ $\eta_{ r}$ 0.11 0.6622 0.8365 0.7308 0.12 0.4675 0.7538 0.6520 0.13 0.3394 0.6807 0.5836 0.14 0.2524 0.6162 0.5242 0.15 0.1915 0.5593 0.4726
下载: 导出CSV
表 4 不同程度输出约束饱和下的性能指标
Table 4 Performance under different degree of output constraint saturation
输出约束 $\eta _{\det }$ $\eta_{\rm dissim}$ $\eta_{ r}$ [-0.75 +0.75] 0.4881 0.4457 0.0879 [-0.70 +0.70] 0.4879 0.4325 0.0606 [-0.65 +0.65] 0.4868 0.4248 0.0444 [-0.60 +0.60] 0.4850 0.4189 0.0340 [-0.55 +0.55] 0.4850 0.4159 0.0269
下载: 导出CSV
表 5 各类测试数据的性能诊断结果
Table 5 Performance diagnosis results corresponding various test data
恶化源 参数值 ${{SI}}_{x1}$ ${{SI}}_{x2}$ ${{SI}}_{x3}$ $\rm {CP}_1$ (20.48 -30.24) 0.9959 0.7029 0.5201 (23.04 -34.02) 0.9992 0.6886 0.5180 (25.60 -37.80) 1.0000 0.6776 0.5163 (28.16 -41.58) 0.9994 0.6685 0.5149 (30.72 -45.36) 0.9978 0.6609 0.5137 $\rm {CP}_2$ 0.11 0.7652 0.9725 0.5231 0.12 0.7217 0.9936 0.5091 0.13 0.6776 1.0000 0.4941 0.13 0.6344 0.9945 0.4797 0.13 0.5928 0.9798 0.4665 $\rm {CP}_3$ [-0.75 +0.75] 0.5345 0.5649 0.9342 [-0.70 +0.70] 0.5230 0.5221 0.9857 [-0.65 +0.65] 0.5163 0.4941 1.0000 [-0.60 +0.60] 0.5120 0.4751 0.9896 [-0.55 +0.55] 0.5088 0.4594 0.9648
下载: 导出CSV
-
[1] 席裕庚, 李德伟, 林姝.模型预测控制-现状与挑战.自动化学报, 2013, 39(3):222-236 doi: 10.1016/S1874-1029(13)60024-5Xi Yu-Geng, Li De-Wei, Lin Shu. Model predictive control-status and challenges. Acta Automatica Sinica, 2013, 39(3):222-236 doi: 10.1016/S1874-1029(13)60024-5 [2] Ellis M, Christofides P D. Economic model predictive control of nonlinear time-delay systems:closed-loop stability and delay compensation. AIChE Journal, 2015, 61(12):4152-4165 doi: 10.1002/aic.v61.12 [3] Müller M A, Angeli D, Allgöwer F. On the performance of economic model predictive control with self-tuning terminal cost. Journal of Process Control, 2014, 24(8):1179-1186 doi: 10.1016/j.jprocont.2014.05.009 [4] Wang L, Li N, Li S Y. Performance monitoring of the data-driven subspace predictive control systems based on historical objective function benchmark. Acta Automatica Sinica, 2013, 39(5):542-547 https://www.researchgate.net/publication/270524834_Performance_Monitoring_of_the_Data-driven_Subspace_Predictive_Control_Systems_Based_on_Historical_Objective_Function_Benchmark [5] Harris T J. Assessment of control loop performance. The Canadian Journal of Chemical Engineering, 1989, 67(5):856-861 doi: 10.1002/cjce.v67:5 [6] 田学民, 罗芝芬, 王平.基于LQG基准的预测控制器经济敏感度分析及调节准则.自动化学报, 2013, 39(10):1735-1740 doi: 10.3724/SP.J.1004.2013.01735Tian Xue-Min, Luo Zhi-Fen, Wang Ping. LQG-based sensitivity analysis and tuning guidelines in economic performance assessment of predictive controller. Acta Automatica Sinica, 2013, 39(10):1735-1740 doi: 10.3724/SP.J.1004.2013.01735 [7] Liu C Y, Huang B, Wang Q L. Control performance assessment subject to multi-objective user-specified performance characteristics. IEEE Transactions on Control Systems Technology, 2011, 19(3):682-691 doi: 10.1109/TCST.2010.2051669 [8] Ge Z Q, Song Z H. An overview of conventional MSPC methods. Multivariate Statistical Process Control. London:Springer, 2013. 5-11 [9] Yan Z B, Chan C L, Yao Y. Multivariate control performance assessment and control system monitoring via hypothesis test on output covariance matrices. Industrial & Engineering Chemistry Research, 2015, 54(19):5261-5271 https://www.researchgate.net/profile/Yuan_Yao10/publication/275970157_Multivariate_Control_Performance_Assessment_and_Control_System_Monitoring_via_Hypothesis_Test_on_Output_Covariance_Matrices/links/554cdff00cf29752ee81d671.pdf [10] Jelali M. Statistical process control. Control Performance Management in Industrial Automation. London:Springer, 2013. 209-217 [11] Zhang Q, Li S Y. Performance monitoring and diagnosis of multivariable model predictive control using statistical analysis. Chinese Journal of Chemical Engineering, 2006, 14(2):207-215 doi: 10.1016/S1004-9541(06)60060-8 [12] AlGhazzawi A, Lennox B. Model predictive control monitoring using multivariate statistics. Journal of Process Control, 2009, 19(2):314-327 doi: 10.1016/j.jprocont.2008.03.007 [13] Chen J H, Wang W Y. PCA-ARMA-based control charts for performance monitoring of multivariable feedback control. Industrial & Engineering Chemistry Research, 2010, 49(5):2228-2241 https://www.researchgate.net/publication/231390600_PCA-ARMA-Based_Control_Charts_for_Performance_Monitoring_of_Multivariable_Feedback_Control [14] Shang C, Huang B, Fan Y, Huang D X. Slow feature analysis for monitoring and diagnosis of control performance. Journal of Process Control, 2016, 39:21-34 doi: 10.1016/j.jprocont.2015.12.004 [15] Das L, Srinivasan B, Rengaswamy R. Multivariate control loop performance assessment with Hurst exponent and Mahalanobis distance. IEEE Transactions on Control Systems Technology, 2016, 24(3):1067-1074 doi: 10.1109/TCST.2015.2468087 [16] Yu J, Qin S J. Statistical MIMO controller performance monitoring. Part I:data-driven covariance benchmark. Journal of Process Control, 2008, 18(3-4):277-296 https://www.researchgate.net/publication/223870439_Statistical_MIMO_Controller_Performance_Monitoring_Part_I_Data-Driven_Covariance_Benchmark [17] Yu J, Qin S J. Statistical MIMO controller performance monitoring. Part II:performance diagnosis. Journal of Process Control, 2008, 18(3-4):297-319 doi: 10.1016/j.jprocont.2007.09.003 [18] Tian X M, Chen G Q, Chen S. A data-based approach for multivariate model predictive control performance monitoring. Neurocomputing, 2011, 74(4):588-597 doi: 10.1016/j.neucom.2010.09.018 [19] 田学民, 史亚杰, 曹玉苹.基于协方差指标预测的MPC实时性能监控.自动化学报, 2013, 39(5):658-663 http://www.aas.net.cn/CN/abstract/abstract17929.shtmlTian Xue-Min, Shi Ya-Jie, Cao Yu-Ping. Real-time performance monitoring of MPC based on covariance index prediction. Acta Automatica Sinica, 2013, 39(5):658-663 http://www.aas.net.cn/CN/abstract/abstract17929.shtml [20] Li C, Huang B, Zheng D, Qian F. Multi-input-multi-output (MIMO) control system performance monitoring based on dissimilarity analysis. Industrial & Engineering Chemistry Research, 2014, 53(47):18226-18235 https://www.researchgate.net/publication/280263633_Multi-input-Multi-output_MIMO_Control_System_Performance_Monitoring_Based_on_Dissimilarity_Analysis?_sg=bUAdqxwkqagD1P7Xssbk_W35jkhbuN3StQIZWLR6_velPNM2YQYCmNSFTRbbaa3JcYxG3f9PvUzbQZVTCN3h1w [21] Wold H. Soft modeling by latent variables:the nonlinear iterative partial least squares approach. Perspectives in Probability and Statistics:Papers in Honour of M.S. Bartlett. New York:Academic Press, 1975. 520-540 [22] Höskuldsson A. PLS regression methods. Journal of Chemometrics, 1988, 2(3):211-228 doi: 10.1002/(ISSN)1099-128X [23] Rosipal R, Trejo L J, Matthews B. Kernel PLS-SVC for linear and nonlinear classification. In:Proceedings of the 20th International Conference on Machine Learning. Washington D.C., USA, 2003. 640-647 [24] Barker M, Rayens W. Partial least squares for discrimination. Journal of Chemometrics, 2003, 17(3):166-173 doi: 10.1002/(ISSN)1099-128X [25] Kano M, Hasebe S, Hashimoto I, Ohno H. Statistical process monitoring based on dissimilarity of process data. AIChE Journal, 2002, 48(6):1231-1240 doi: 10.1002/(ISSN)1547-5905 [26] Yuan Q L, Lennox B, McEwan M. Analysis of multivariable control performance assessment techniques. Journal of Process Control, 2009, 19(5):751-760 doi: 10.1016/j.jprocont.2008.10.001 [27] Tan S, Wang F L, Peng J, Chang Y Q, Wang S. Multimode process monitoring based on mode identification. Industrial & Engineering Chemistry Research, 2012, 51(1):374-388 https://www.researchgate.net/publication/263957976_Multimode_Process_Monitoring_Based_on_Mode_Identification [28] Zheng Y, Qin S J, Wang F L. PLS-based similarity analysis for mode identification in multimode manufacturing processes. In:Proceedings of the 9th IFAC Symposium on Advanced Control of Chemical Processes. Whistler, British Columbia, Canada:Elsevier, 2015, 48(8):777-782 -

 下载:
下载:

计量
- 文章访问数: 2285
- HTML全文浏览量: 339
- PDF下载量: 939
- 被引次数: 0
