


An Industrial Fault Detection Method Based on Cross-domain Causal Transfer Learning
-
摘要: 针对新工况早期样本不足导致的故障检测难题, 提出一种基于跨域因果迁移学习的工业故障检测方法, 实现了历史工况数据公共特征与系统稳定因果结构的同步迁移, 有效提升了跨域检测的能力. 该方法利用典范多因子分解从多个历史工况中提取跨域低维公共特征, 提出面向公共得分变量与关键工艺变量组成的候选节点集合的因果结构学习方法, 并从边存在频率、方向一致性、局部作用稳定性和边级分布漂移四个角度筛选跨域稳定公共因果边; 进一步地将稳定公共因果图引入目标域, 构建图结构约束下的多源迁移模型及其联合迁移优化学习算法; 最后基于历史模式的公共特征和来自新工况残差的特殊特征设计检测统计量, 搭建完整的跨域检测架构. 在污水处理和连续搅拌釜反应器的实验结果表明, 所提方法能够实现多源传感数据公共特征和变量因果结构的跨域稳定迁移, 提高了少样本新工况下故障检测的可靠性与可解释性.Abstract: To address the challenge of fault detection under new operating conditions with insufficient early-stage samples, an industrial fault detection method based on cross-domain causal transfer learning is proposed. The proposed method enables the synchronous transfer of common features extracted from historical operating conditions data and stable causal structures of the system, thereby improving cross-domain fault detection performance. Specifically, canonical polyadic decomposition is employed to extract cross-domain low-dimensional common features shared across multiple historical operating conditions. A causal structure learning method is then developed for a candidate node set comprising common score variables and key process variables. Stable causal edges shared across domains are identified based on four criteria: Edge existence frequency, directional consistency, local effect stability, and edge-level distribution shift. Furthermore, the resulting stable common causal graph is incorporated into the target domain to construct a graph-structure-constrained multi-source transfer model, together with a joint transfer optimization algorithm. Finally, detection statistics are designed by combining common features extracted from historical modes with domain-specific features extracted from residuals under the new operating condition, thereby establishing a comprehensive cross-domain detection framework. Experimental results on wastewater treatment and continuous stirred-tank reactor demonstrate that the proposed method enables the cross-domain stable transfer of common features and variable-level causal structures of multi-source sensor data, improving the reliability and interpretability of fault detection under new operating conditions with limited samples.
-
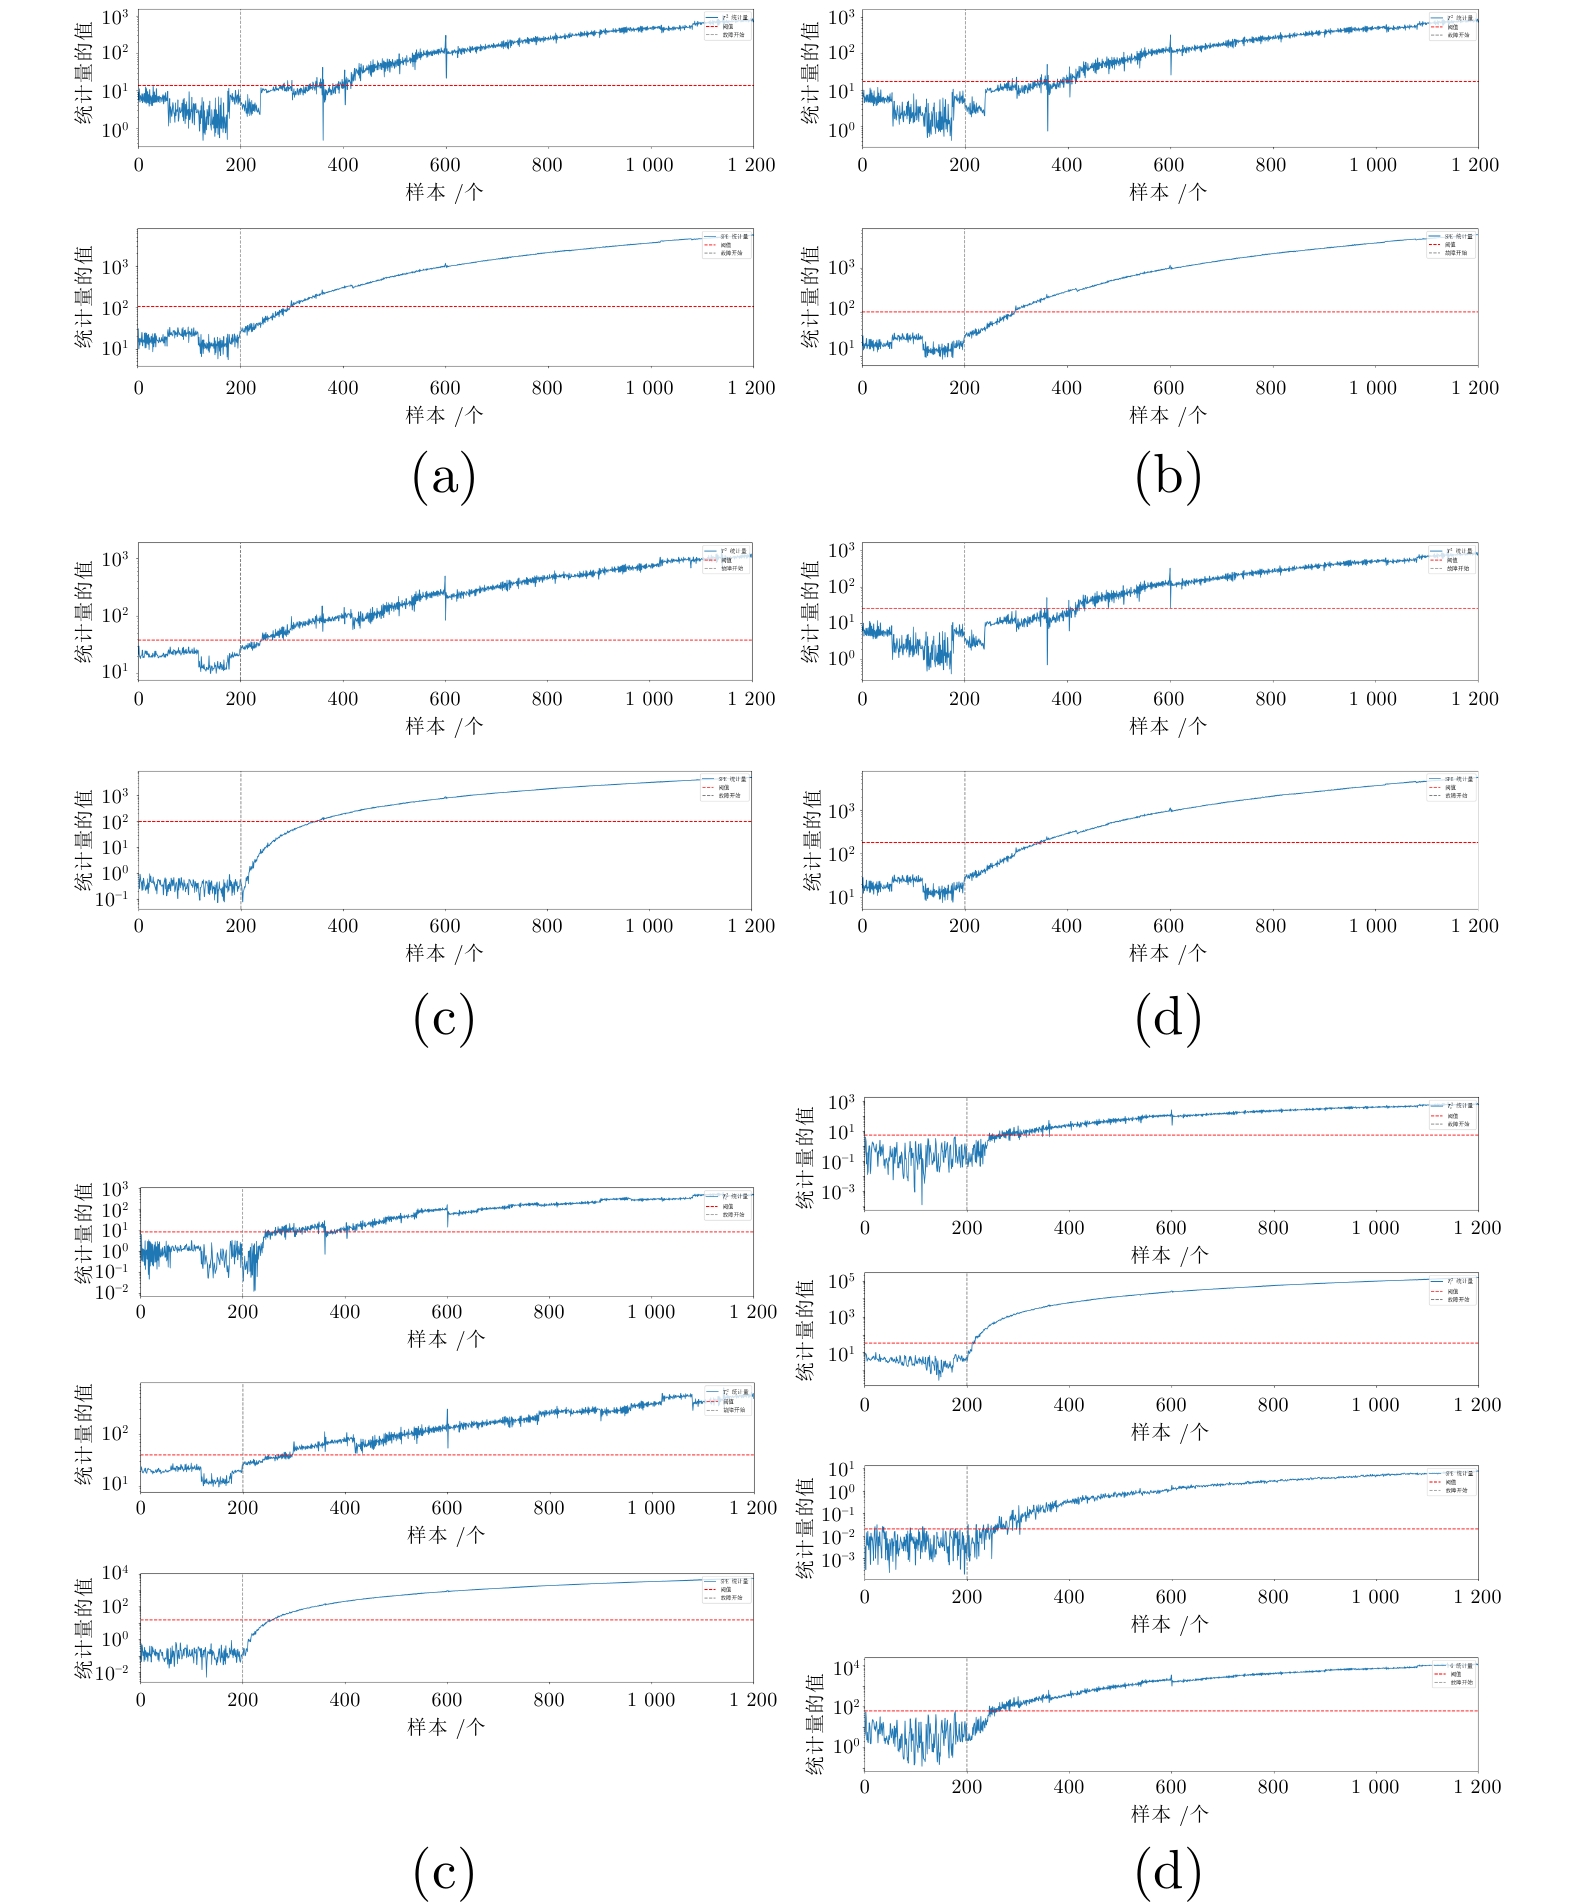
图 6 连续搅拌釜式反应器故障7的检测结果 ((a) PCA; (b) SPCA; (c) TCA; (d) GraphPCA; (e) CPD-based方法; (f) CTL)
Fig. 6 Detection results for fault 7 of the CSTR ((a) PCA; (b) SPCA; (c) TCA; (d) GraphPCA; (e) CPD-based method; (f) CTL)
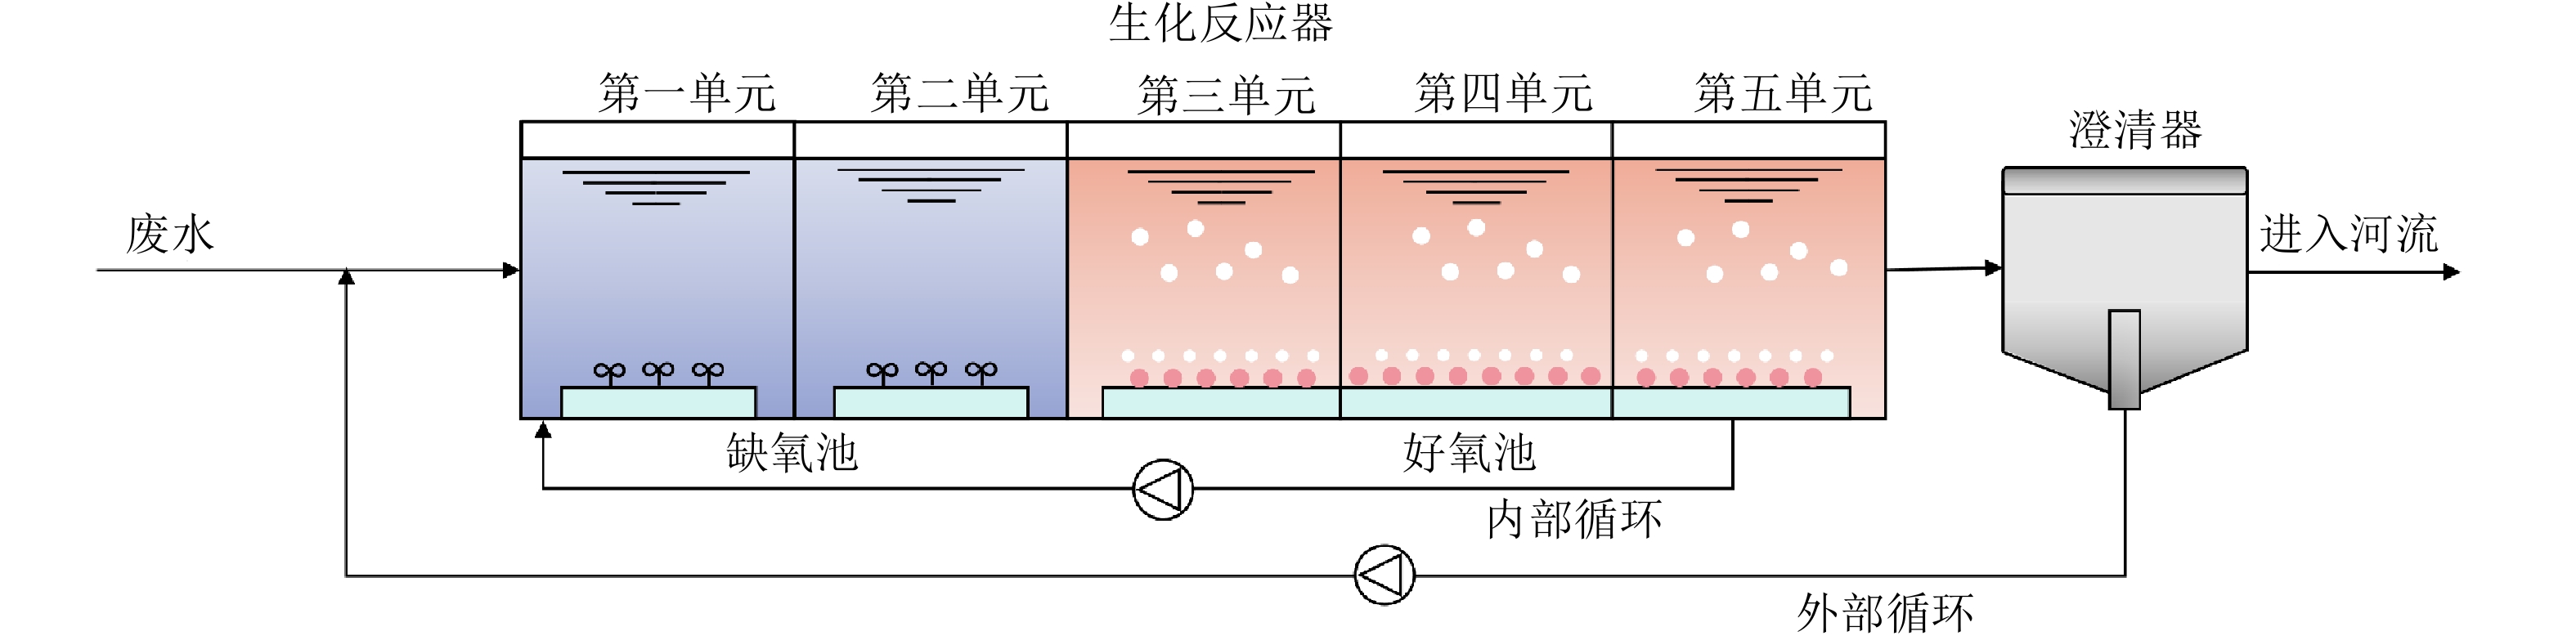
图 7 一号基准仿真模型 (BSM1) 示意图
Fig. 7 Schematic diagram of benchmark simulation model no. 1 (BSM1)
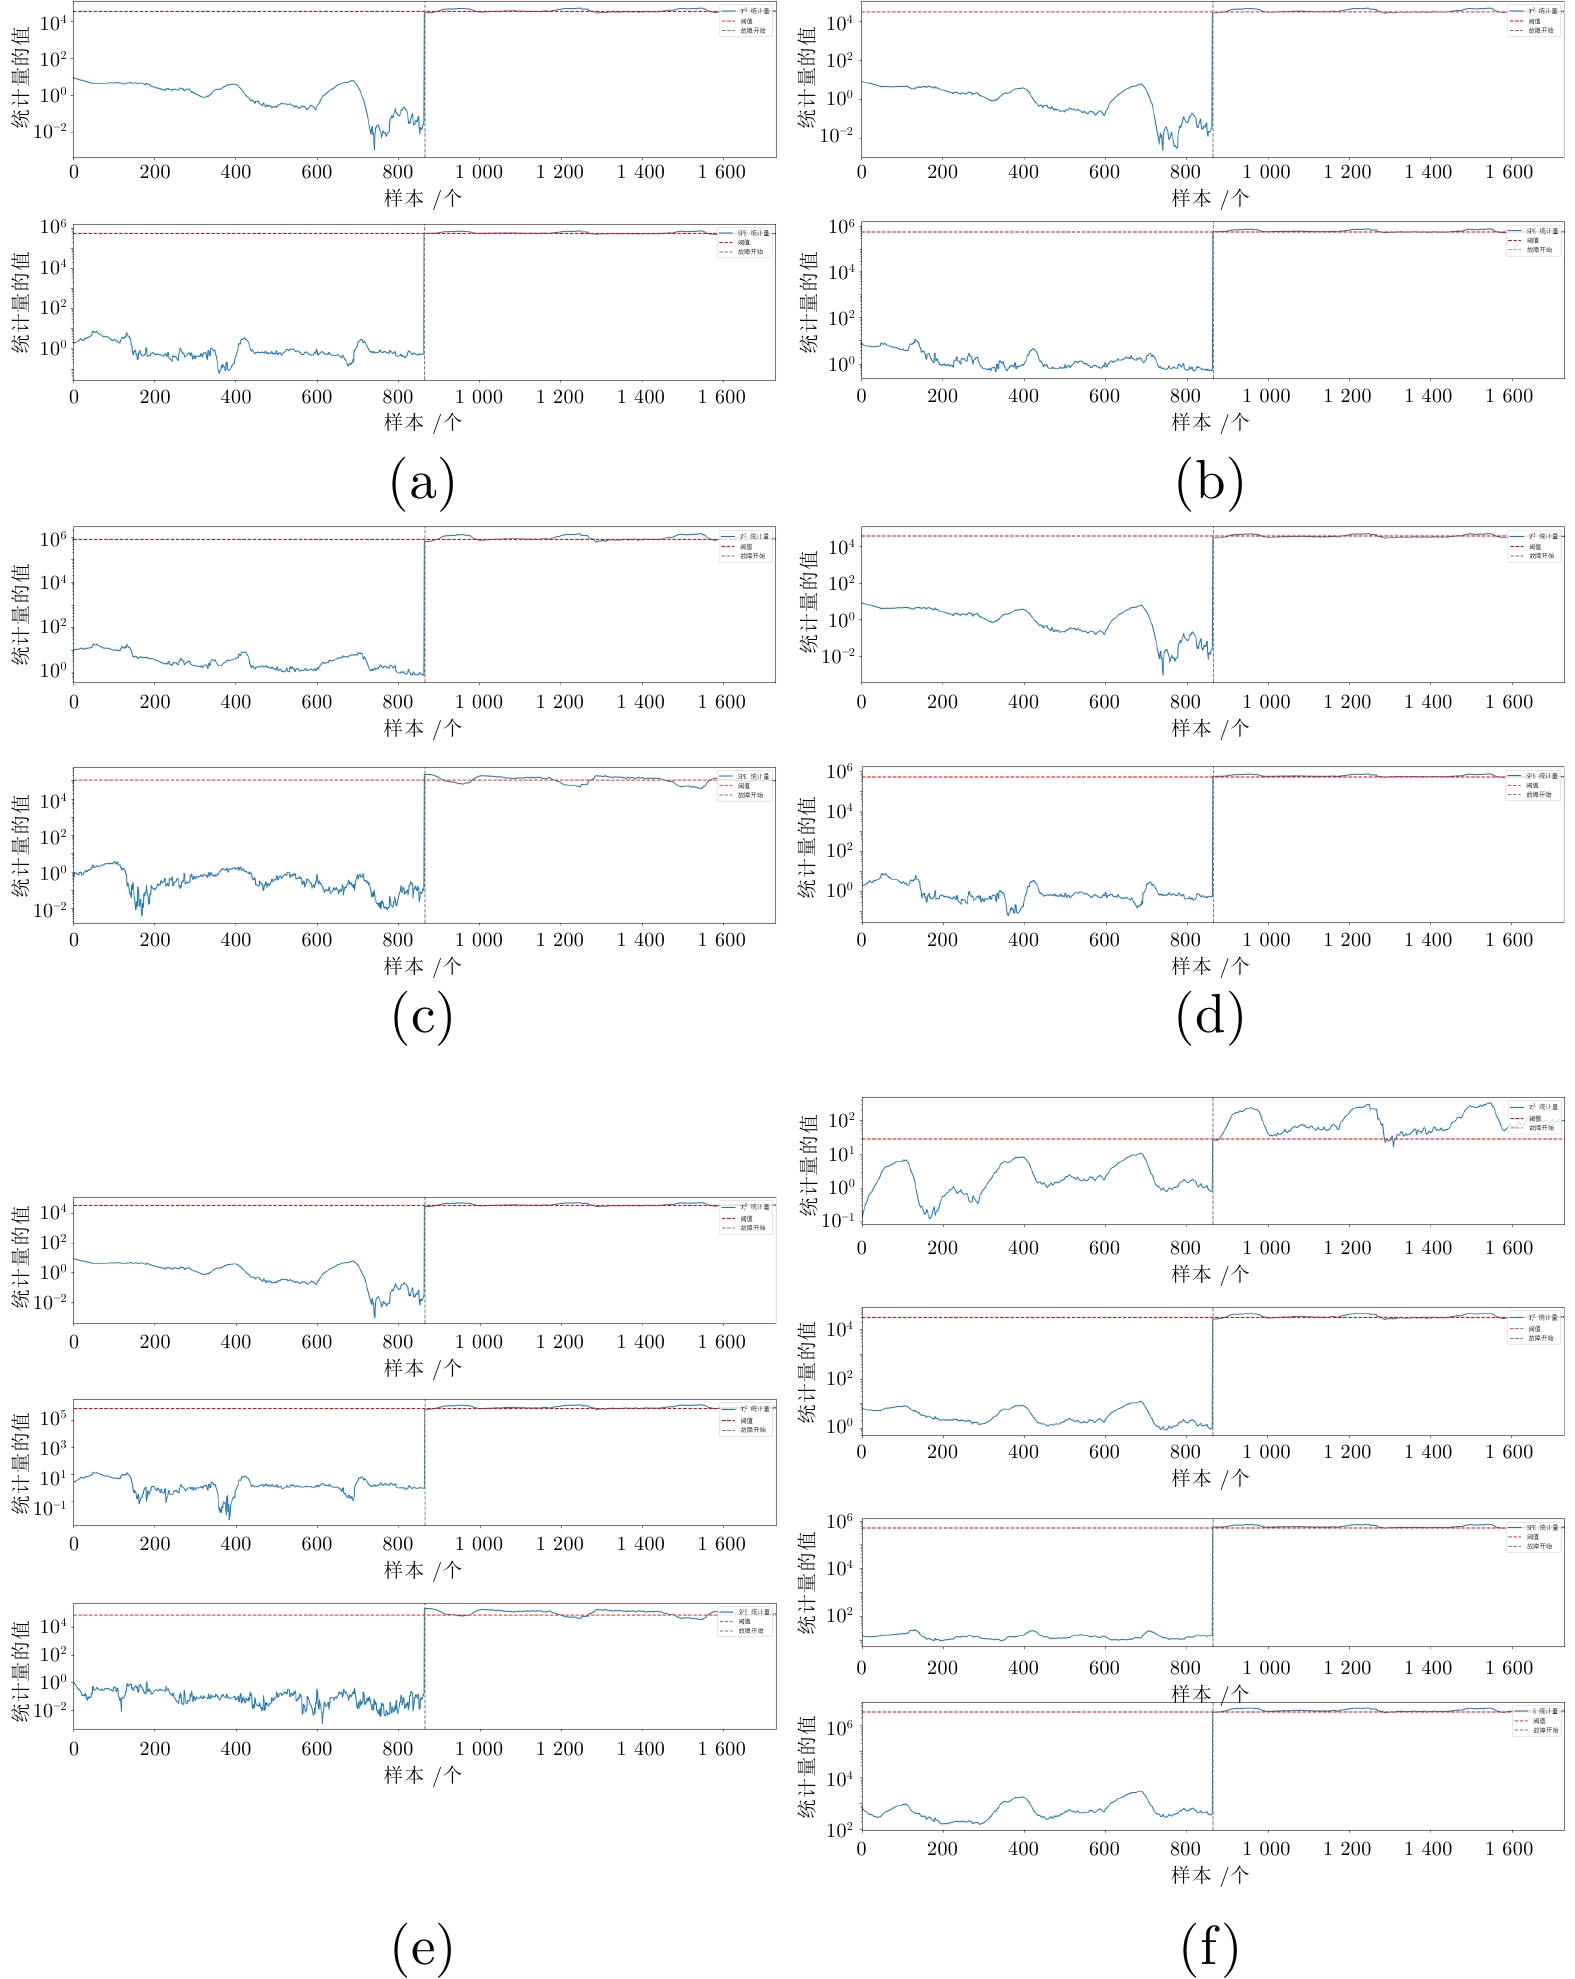
图 10 废水处理工艺故障4的检测结果 ((a) PCA; (b) SPCA; (c) TCA; (d) GraphPCA; (e) CPD-based方法; (f) CTL)
Fig. 10 Detection results for fault 4 of the WWTP ((a) PCA; (b) SPCA; (c) TCA; (d) GraphPCA; (e) CPD-based method; (f) CTL)
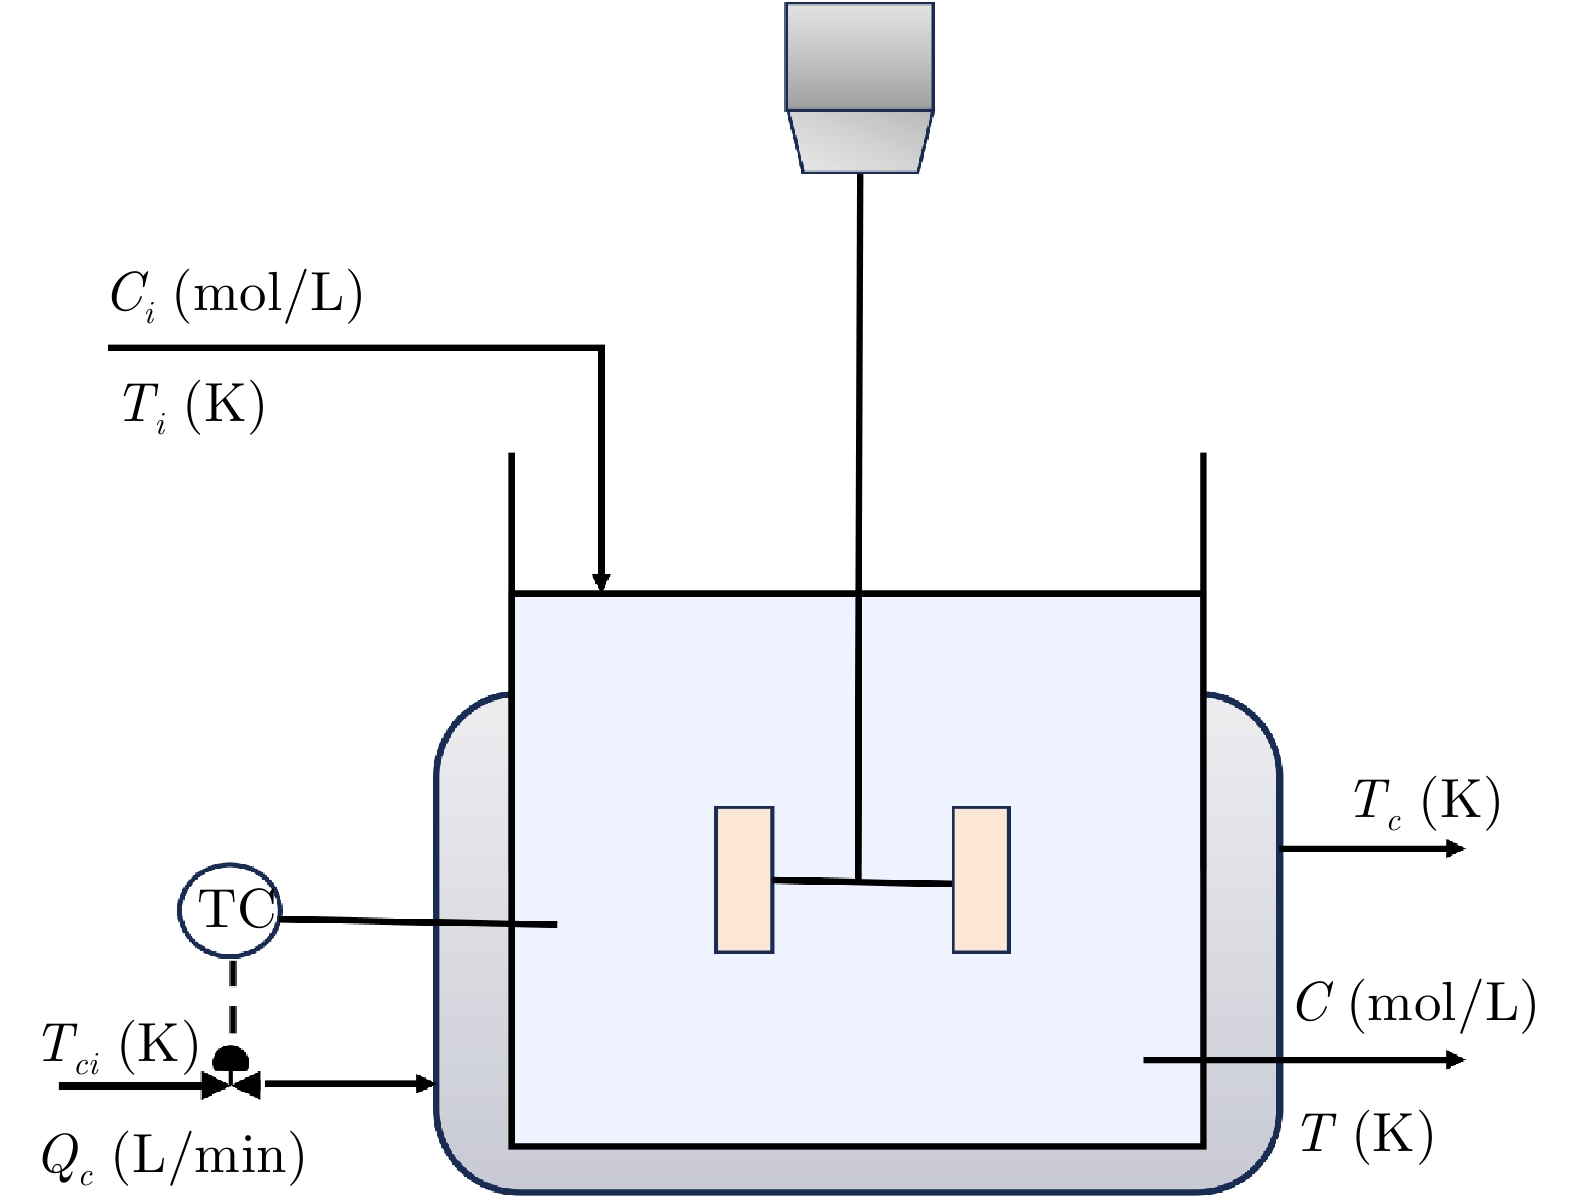
表 1 连续搅拌釜反应器模型中的常数值
Table 1 Constant values in the CSTR model
参数 描述 值 单位 $Q$ 入口流量 100.0 L/min $V$ 储罐容积 150.0 L $V_c$ 护套容积 10.0 L $\Delta H$ 反应热 $-2.0 \times 10^5$ cal/mol $k_0$ $k$的前置指数因子 $7.2 \times 10^{10}$ min$^{-1}$ $\rho$、$\rho_c$ 流体密度 1 000 g/L $UA$ 传热系数 $7.0 \times 10^5$ cal/min/K $E/R$ 活化能 $1.0 \times 10^4$ K $C_p$、$C_{pc}$ 流体热容 1.0 cal/g/K  下载: 导出CSV
表 2 连续搅拌釜反应器中的早期故障场景
Table 2 Incipient fault scenarios in the CSTR
故障 描述$^\dagger$ $\varphi^\ddagger$的值 类型 1 $\mu = \mu_0 \exp(-\varphi t)$ 0.000 5 乘性 2 $\vartheta = \vartheta_0 \exp(-\varphi t)$ 0.001 乘性 3 同时发生故障1和故障2 / 乘性 4 $C_i = C_{i,\;0} + \varphi t$ 0.001 加性 5 $T_i = T_{i,\;0} + \varphi t$ 0.05 加性 6 $T_{ci} = T_{ci,\;0} + \varphi t$ 0.05 加性 7 $C = C_0 + \varphi t$ 0.001 加性 8 $T = T_0 + \varphi t$ 0.05 加性 9 $T_c = T_{c,\;0} + \varphi t$ 0.05 加性 10 $Q_c = Q_{c,\;0} + \varphi t$ $-0.1$ 加性 注: $^\dagger$所有$t$单位为分钟, 下标0代表额定标称值, $^\ddagger$$\varphi$为故障演化速 率系数
下载: 导出CSV
表 3 连续搅拌釜反应器的运行模式描述
Table 3 Operating modes description of the CSTR
模式 描述 模式1 $C_i$=1.0 mol/L, $T_i=350^\circ{\rm{C}} $, $T_{ci}=350^\circ{\rm{C}} $ 模式2 $C_i$=1.02 mol/L, $T_i=348^\circ{\rm{C}} $, $T_{ci}=350^\circ{\rm{C}} $ 模式3 $C_i$=1.04 mol/L, $T_i=346^\circ{\rm{C}} $, $T_{ci}=347^\circ{\rm{C}} $
下载: 导出CSV
表 4 连续搅拌釜式反应器故障检测FAR结果(%)
Table 4 FAR results of fault detection for CSTR (%)
故障
编号PCA SPCA TCA CPD-based GraphPCA CTL $T^2$ SPE $T^2$ SPE $T^2$ SPE $T^2$ SPE $T^2$ SPE $T^2_c$ $T^2_i$ SPE G 故障1 0 0 1.51 0 3.02 0 0 0 0.50 5.53 0 0 0 0 故障2 3.02 0 3.02 1.01 0 0 0 0 0.50 9.05 0 0 0 0 故障3 0 0 1.01 0 0 0 0 0 0 3.02 0 0 0 0 故障4 0 0 0 0 0 0 0 0 0 0 0 0 0 0 故障5 0 0 0 0 0 0 0 0.50 0 0 0 0 0 0 故障6 0 0 0 0 0 0 0 0 0 0 0 0 0 0 故障7 0 0 0 0 0 0 0 0 0 0.50 0 0 0.50 0 故障8 0 0 0 0 0 0 2.50 0.50 0 0 0 0 0 0 故障9 0 0 0 0 0 0 2.00 4.00 0 0 0.50 0 0 0 故障10 0 0 0 3.02 8.04 0 0 0 0 0 0 0 0 0
下载: 导出CSV
表 5 连续搅拌釜式反应器故障检测FDR结果(%)
Table 5 FDR results of fault detection for CSTR (%)
故障编号 PCA SPCA TCA CPD-based GraphPCA CTL $ T^2 $ SPE $ T^2 $ SPE $ T^2 $ SPE $ T^2_c $ $ T^2_s $ SPE $ T^2 $ SPE $ T^2_c $ $ T^2_i $ SPE G 故障1 47.75 42.56 62.84 62.34 61.74 62.64 77.70 59.40 67.20 53.75 54.35 99.00 90.10 97.40 99.10 故障2 30.37 65.43 31.97 78.12 62.74 86.51 67.90 70.40 89.10 58.24 70.73 94.30 81.20 96.60 94.30 故障3 48.35 68.23 50.45 75.02 69.83 79.92 69.20 68.40 83.90 52.05 69.43 96.00 96.10 95.70 96.00 故障4 64.44 73.23 64.34 75.72 69.93 82.72 67.80 21.30 94.00 63.44 73.53 0.79 78.10 96.80 76.60 故障5 93.61 89.91 90.91 91.71 59.14 88.21 75.30 89.30 96.40 92.91 90.01 0.66 72.10 99.10 80.30 故障6 70.83 90.51 70.83 91.71 93.11 91.61 75.00 87.90 96.10 72.03 90.61 93.60 90.10 96.00 93.50 故障7 78.12 85.31 81.72 88.61 95.00 94.91 90.70 91.30 94.30 81.82 90.11 95.40 98.90 94.50 95.60 故障8 67.03 79.32 89.11 75.42 76.92 79.42 75.80 60.70 92.10 75.72 60.24 0.86 0.90 0.99 84.70 故障9 49.95 64.04 66.13 72.33 72.13 84.22 74.50 31.80 94.20 64.44 72.73 96.70 96.10 98.90 99.80 故障10 13.19 45.15 33.37 65.93 63.54 78.22 45.40 55.90 82.30 42.06 51.25 99.60 96.10 95.00 100.0
下载: 导出CSV
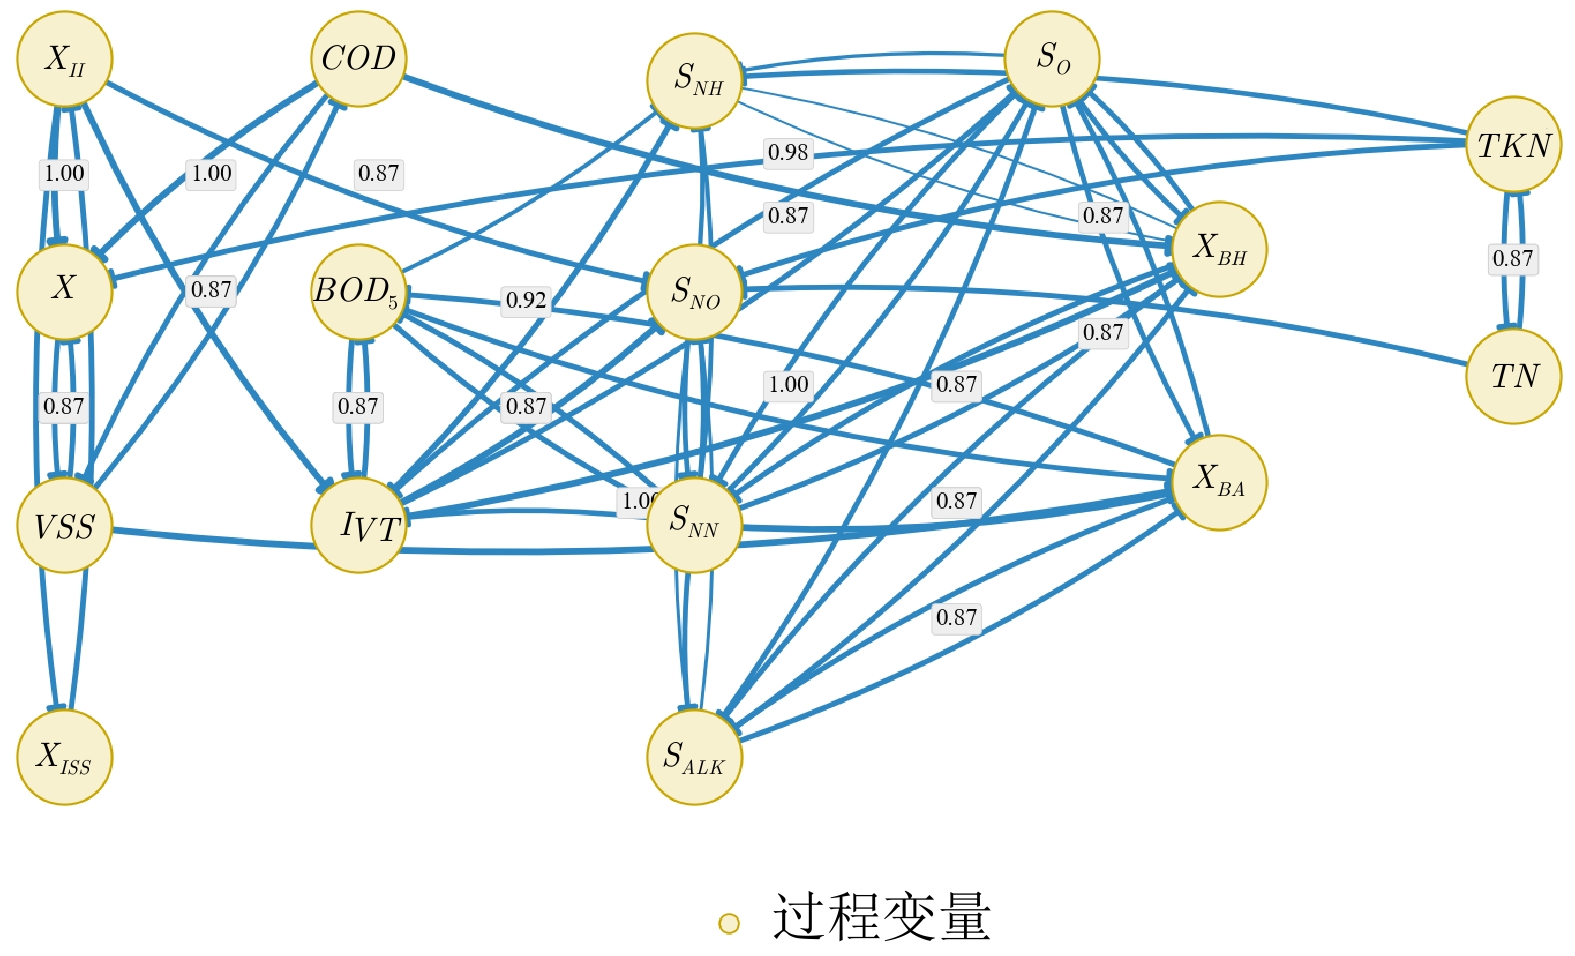
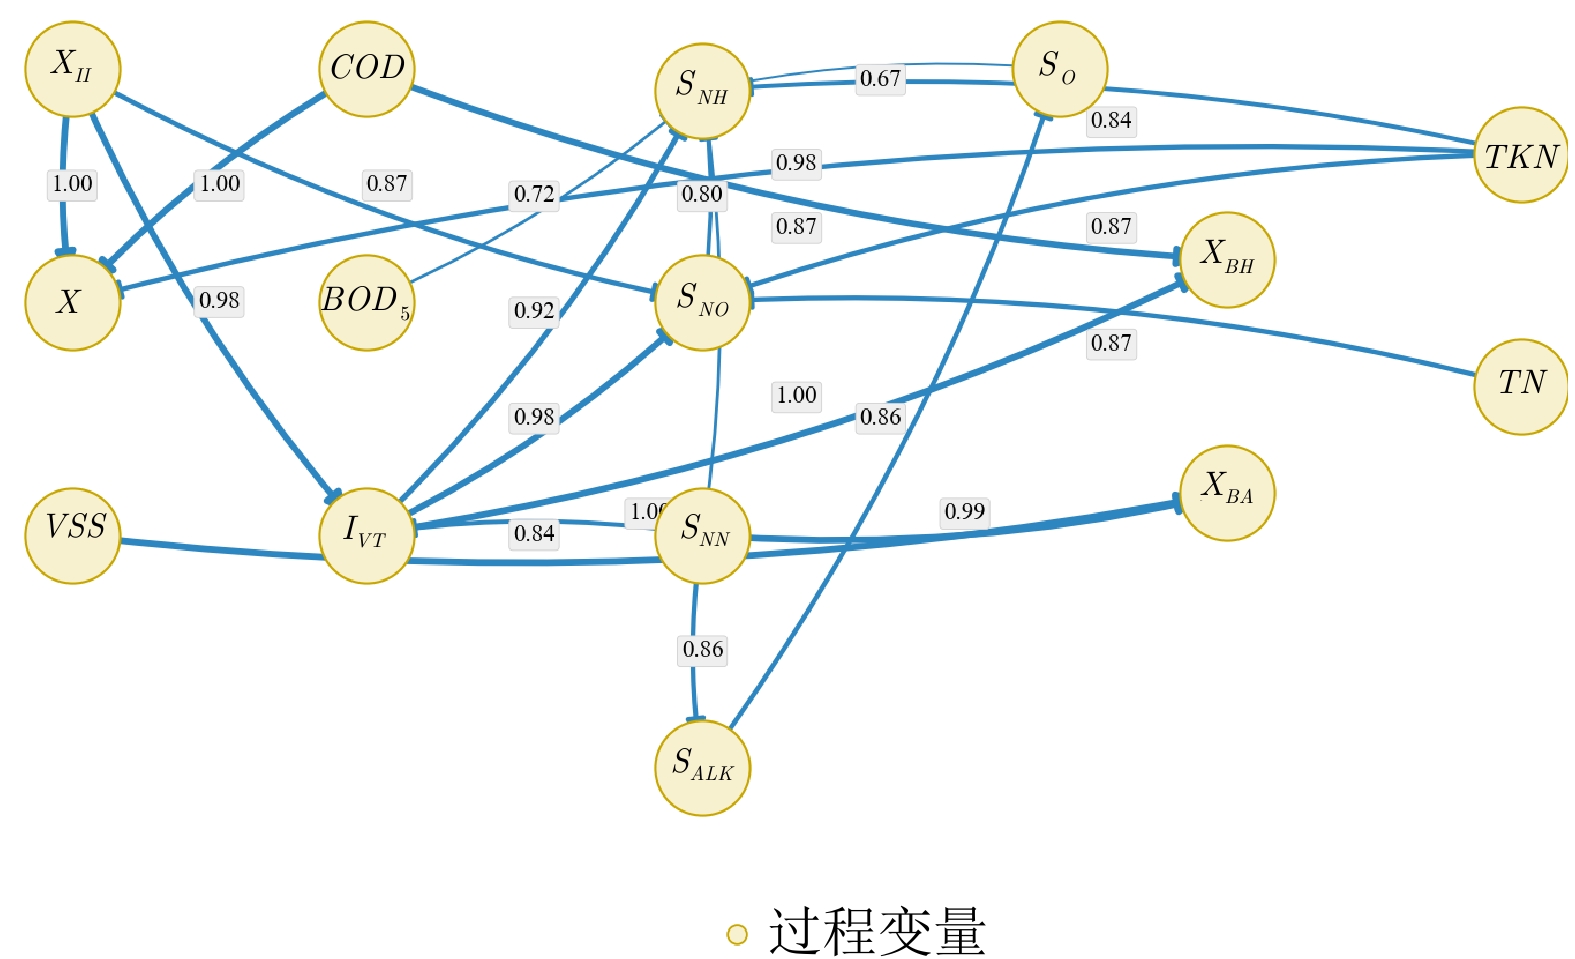
表 6 废水处理工艺输入变量的具体含义与单位
Table 6 Specific meanings and units of input variables for WWTP
变量 描述 单位 $S_O$ 溶解氧 mg O2/L $S_{NN}$ 分子氮/氮气态氮 mg N/L $S_{ALK}$ 碱度 mol ${\mathrm{HCO}}_3^-$/m3 $X_{II}$ 惰性无机悬浮固体 mg SS/L $X$ 总悬浮固体 mg SS/L $VSS$ 挥发性悬浮固体 mg SS/L $X_{ISS}$ 总无机悬浮固体 mg SS/L $I_{VT}$ VSS/TSS比值 g VSS/g TSS $COD$ 总化学需氧量 mg COD/L $BOD_5$ 五日生化需氧量 mg ${\mathrm{O}}_2$/L $S_{NH}$ 氨氮, 即$NH_4^+ + NH_3$-N mg N/L $S_{NO}$ 硝酸盐和亚硝酸盐氮 mg N/L $TKN$ 总凯氏氮 mg N/L $TN$ 总氮 mg N/L $X_{BH}$ 活性异养菌生物量 mg COD/L $X_{BA}$ 活性自养菌生物量(硝化菌) mg COD/L
下载: 导出CSV
表 7 废水处理工艺实验中的故障描述
Table 7 Fault description for WWTP experiments
故障编号 故障描述 故障类型 1 第二单元异养菌的最大比生长速率
从4.00变为6.00动力学参数故障 2 第二单元异养菌的衰减速率
从0.62变为0.20动力学参数故障 3 第四单元自养菌的衰减速率
从0.17变为0.05动力学参数故障 4 第五单元异养菌的最大比生长速率
从3.20变为1.00动力学参数故障 5 第五单元异养菌的衰减速率
从0.62变为1.80动力学参数故障 6 第五单元循环流量从50变到100 操作参数故障
下载: 导出CSV
表 8 废水处理工艺故障检测FDR结果 (%)
Table 8 FDR results of fault detection for WWTP (%)
故障编号 PCA SPCA TCA CPD-based Graph-PCA CTL $ T^2 $ SPE $ T^2 $ SPE $ T^2 $ SPE $ T^2_c $ $ T^2_i $ SPE $ T^2 $ SPE $ T^2_c $ $ T^2_i $ SPE G 故障1 24.97 26.01 52.95 56.53 70.64 69.36 83.56 84.14 76.62 69.71 62.54 91.78 97.34 96.88 96.64 故障2 44.62 30.75 59.08 61.50 77.57 76.53 86.11 87.15 82.41 75.26 66.71 93.87 97.80 97.34 97.11 故障3 47.75 33.64 53.18 57.80 75.72 66.82 77.55 79.75 76.50 56.76 60.12 92.25 93.98 95.25 96.88 故障4 47.40 49.48 58.84 55.14 76.18 71.91 81.48 82.75 79.05 70.87 71.56 94.91 91.44 95.72 95.37 故障5 33.18 34.91 54.10 45.90 67.05 67.17 79.51 80.44 78.59 73.76 71.68 46.53 93.29 92.82 96.99 故障6 36.42 41.39 52.37 49.48 74.45 71.79 80.21 84.03 79.40 73.41 61.97 93.17 95.72 96.06 95.37
下载: 导出CSV
-
[1] Mohr F, Arnese-Feffin E, Barolo M, Braatz R D. Smart process analytics for process monitoring. Computers & Chemical Engineering, 2025, 194: Article No. 108918 doi: 10.1016/j.compchemeng.2024.108918 [2] 彭开香, 马亮, 张凯. 复杂工业过程质量相关的故障检测与诊断技术综述. 自动化学报, 2017, 43(3): 349−365 doi: 10.16383/j.aas.2017.c160427Peng Kai-Xiang, Ma Liang, Zhang Kai. Review of quality-related fault detection and diagnosis techniques for complex industrial processes. Acta Automatica Sinica, 2017, 43(3): 349−365 doi: 10.16383/j.aas.2017.c160427 [3] Li S J, Zhou B H, Shang J L, Chen X F, Yu J B. Review of recent applications and future perspectives on process monitoring approaches in industrial processes. Journal of Manufacturing Systems, 2025, 82: 509−530 doi: 10.1016/j.jmsy.2025.07.002 [4] Kini K R, Harrou F, Madakyaru M, Sun Y. Enhancing fault detection in multivariate industrial processes: Kolmogorov-Smirnov non-parametric statistical approach. Computers & Chemical Engineering, 2025, 192: Article No. 108876 doi: 10.1016/j.compchemeng.2024.108876 [5] Zhou P, Zhang R Y, Xie J, Liu J P, Wang H, Chai T Y. Data-driven monitoring and diagnosing of abnormal furnace conditions in blast furnace ironmaking: An integrated PCA-ICA method. IEEE Transactions on Industrial Electronics, 2021, 68(1): 622−631 doi: 10.1109/TIE.2020.2967708 [6] Xue J Y, Zhang T S, Ye H. KPI-oriented process monitoring based on causal-weighted partial least squares. Information Sciences, 2025, 689: Article No. 121470 doi: 10.1016/j.ins.2024.121470 [7] Liu T T, Wang J, Luo H, Wang Z H, Zhou M. Hierarchical canonical correlation analysis with application to process monitoring. IEEE Transactions on Industrial Informatics, 2025, 21(9): 6834−6844 doi: 10.1109/TII.2025.3567402 [8] Huang K K, Wen H F, Zhou C, Yang C H, Gui W H. Transfer dictionary learning method for cross-domain multimode process monitoring and fault isolation. IEEE Transactions on Instrumentation and Measurement, 2020, 69(11): 8713−8724 doi: 10.1109/TIM.2020.2998875 [9] Zhang R, Tao H Y, Wu L F, Guan Y. Transfer learning with neural networks for bearing fault diagnosis in changing working conditions. IEEE Access, 2017, 5: 14347−14357 doi: 10.1109/ACCESS.2017.2720965 [10] Zhang Z, Chen P P, Xing C G, Liu B, Wang R, Li L X. A data augmentation boosted dual informer framework for the performance degradation prediction of aero-engines. IEEE Sensors Journal, 2023, 23(11): 12018−12030 doi: 10.1109/JSEN.2023.3269030 [11] Hu Y D, Liu R N, Li X L, Chen D Y, Hu Q H. Task-sequencing meta learning for intelligent few-shot fault diagnosis with limited data. IEEE Transactions on Industrial Informatics, 2022, 18: 3894−3904 doi: 10.1109/TII.2021.3112504 [12] Zhuang F Z, Qi Z Y, Duan K Y, Xi D B, Zhu Y C, Zhu H S. A comprehensive survey on transfer learning. Proceedings of the IEEE, 2021, 109(1): 43−76 doi: 10.1109/JPROC.2020.3004555 [13] Chai Z, Zhao C H, Huang B. Cross-domain knowledge transfer in industrial process monitoring: A survey. Journal of Process Control, 2025, 149: Article No. 103408 doi: 10.1016/j.jprocont.2025.103408 [14] Pan S J, Tsang I W, Kwok J T, Yang Q. Domain adaptation via transfer component analysis. IEEE Transactions on Neural Networks, 2011, 22(2): 199−210 doi: 10.1109/TNN.2010.2091281 [15] Wang K, Zhou W, Liu C, Yuan X, Wang Y. A multi-source transfer learning method for new mode monitoring in industrial processes. In: Proceedings of the 8th International Conference on Control, Decision and Information Technologies (CoDIT). Istanbul, Turkey: IEEE, 2022. 124–129 [16] Wang K, Lei X, Zhou W X, Cheng S G, Li J. Historical information-aided monitoring of few-sample modes in industrial processes with orthogonal transferred projection. IEEE Transactions on Industrial Informatics, 2024, 20(8): 10375−10386 doi: 10.1109/TII.2024.3396551 [17] Li L L, Chen X, Peng X, Yang D, Liu W J. A transfer-learning-based fault detection approach for nonlinear industrial processes under unusual operating conditions. IEEE Transactions on Industrial Informatics, 2024, 20(4): 5374−5382 doi: 10.1109/TII.2023.3333928 [18] Wang J, Li T Y, Liu T T, Lei Z W, Zhou M, Su R. A multi-sensors nonlinear industrial process fault detection method based on Procrustes analysis transfer learning. The Canadian Journal of Chemical Engineering, 2026. [19] Liu X, Li Y, Chen L, Chen G X, Zhao B Y. Multiple source partial knowledge transfer for manufacturing system modelling. Robotics and Computer-Integrated Manufacturing, 2023, 80: Article No. 102468 doi: 10.1016/j.rcim.2022.102468 [20] Qiang B Y, Shi K N, Ren J X, Shi Y Y. Multi-source online transfer learning based on hybrid physics-data model for cross-condition tool health monitoring. Journal of Manufacturing Systems, 2024, 77: 1−17 doi: 10.1016/j.jmsy.2024.08.028 [21] Dong J, Guo X, Zhang C, Peng K X. Multi-level monitoring method based on slow independent component analysis-tensor decomposition for industrial batch processes. Measurement, 2025, 241: Article No. 115610 doi: 10.1016/j.measurement.2024.115610 [22] Sidiropoulos N D, de Lathauwer L, Fu X, Huang K, Papalexakis E E, Faloutsos C. Tensor decomposition for signal processing and machine learning. IEEE Transactions on Signal Processing, 2017, 65(13): 3551−3582 doi: 10.1109/tsp.2017.2690524 [23] Nomikos P, MacGregor J F. Monitoring batch processes using multiway principal component analysis. AIChE Journal, 1994, 40(8): 1361−1375 doi: 10.1002/aic.690400809 [24] Liu J X, Hou J, Chen J H. Dual-layer feature extraction based soft sensor methods and applications to industrial polyethylene processes. Computers & Chemical Engineering, 2021, 154: Article No. 107469 doi: 10.1016/j.compchemeng.2021.107469 [25] Cheng Y H, Zhang W, Wang H Y, Wang X S. Causal meta-transfer learning for cross-domain few-shot hyperspectral image classification. IEEE Transactions on Geoscience and Remote Sensing, 2023, 61: Article No. 5521014 [26] Rojas-Carulla M, Schölkopf B, Turner R, Peters J. Invariant models for causal transfer learning. Journal of Machine Learning Research, 2018, 19: 1−34 [27] Dong J, Li D Y, Wei Y M, Peng K X. A novel process monitoring and root cause diagnosis strategy based on knowledge-data-integrated causal digraph for complex industrial processes. IEEE Transactions on Instrumentation and Measurement, 2025, 74: 1−12 doi: 10.1109/tim.2024.3497056 [28] Gharahbagheri H, Imtiaz S A, Khan F. Root cause diagnosis of process fault using KPCA and Bayesian network. Industrial & Engineering Chemistry Research, 2017, 56(8): 2054−2070 doi: 10.1021/acs.iecr.6b01916 [29] Sui Q K, Wang Y L, Liu C L, Wang K, Sun B. Attribution-aided nonlinear Granger causality discovery method and its industrial application. IEEE Transactions on Industrial Informatics, 2025, 21(8): 6147−6157 doi: 10.1109/TII.2025.3558343 [30] Yang F, Xiao D Y. Progress in root cause and fault propagation analysis of large-scale industrial processes. Journal of Control Science and Engineering, 2012, 2012(1): Article No. 478373 [31] Bauer M, Thornhill N F. A practical method for identifying the propagation path of plant-wide disturbances. Journal of Process Control, 2008, 18(7-8): 707−719 doi: 10.1016/j.jprocont.2007.11.007 [32] Jiang D N, Zhang W D, Cao H C, Shen F Y. Top-blown furnace sensor fault diagnosis based on causal graphs and disentangled learning. IEEE Transactions on Instrumentation and Measurement, 2025, 74: 1−16 [33] Wang K, Zhou W X, Mo Y F, Yuan X F, Wang Y L, Yang C H. New mode cold start monitoring in industrial processes: A solution of spatial-temporal feature transfer. Knowledge-Based Systems, 2022, 248: Article No. 108851 doi: 10.1016/j.knosys.2022.108851 [34] Cui M L, Ma X, Wang Y Q, Guo J P, Hou T Z. Fast sparse dynamic matrix estimation method with differential information for industrial process monitoring. IEEE Transactions on Control Systems Technology, 2025, 33(2): 512−525 doi: 10.1109/TCST.2024.3483431 [35] Maćkiewicz A, Ratajczak W. Principal components analysis (PCA). Computers & Geosciences, 1993, 19(3): 303−342 doi: 10.1016/0098-3004(93)90090-R [36] Gajjar S, Kulahci M, Palazoglu A. Real-time fault detection and diagnosis using sparse principal component analysis. Journal of Process Control, 2018, 67: 112−128 doi: 10.1016/j.jprocont.2017.03.005 [37] Yang J Y, Wang L, Liu L, Zheng X Q. GraphPCA: A fast and interpretable dimension reduction algorithm for spatial transcriptomics data. Genome Biology, 2024, 25: Article No. 287 doi: 10.1186/s13059-024-03429-x [38] Kini K R, Harrou F, Madakyaru M, Sun Y. Label-free anomaly detection in wastewater treatment plants via enhanced independent component analysis. Scientific Reports, 2026, 16: Article No. 20932 doi: 10.1038/s41598-026-51661-1 -

 下载:

计量
- 文章访问数: 10
- HTML全文浏览量: 4
- 被引次数: 0
