

Improved Multi-dimensional Grey Prediction Model Based on Background Value and Structural Compatibility
-
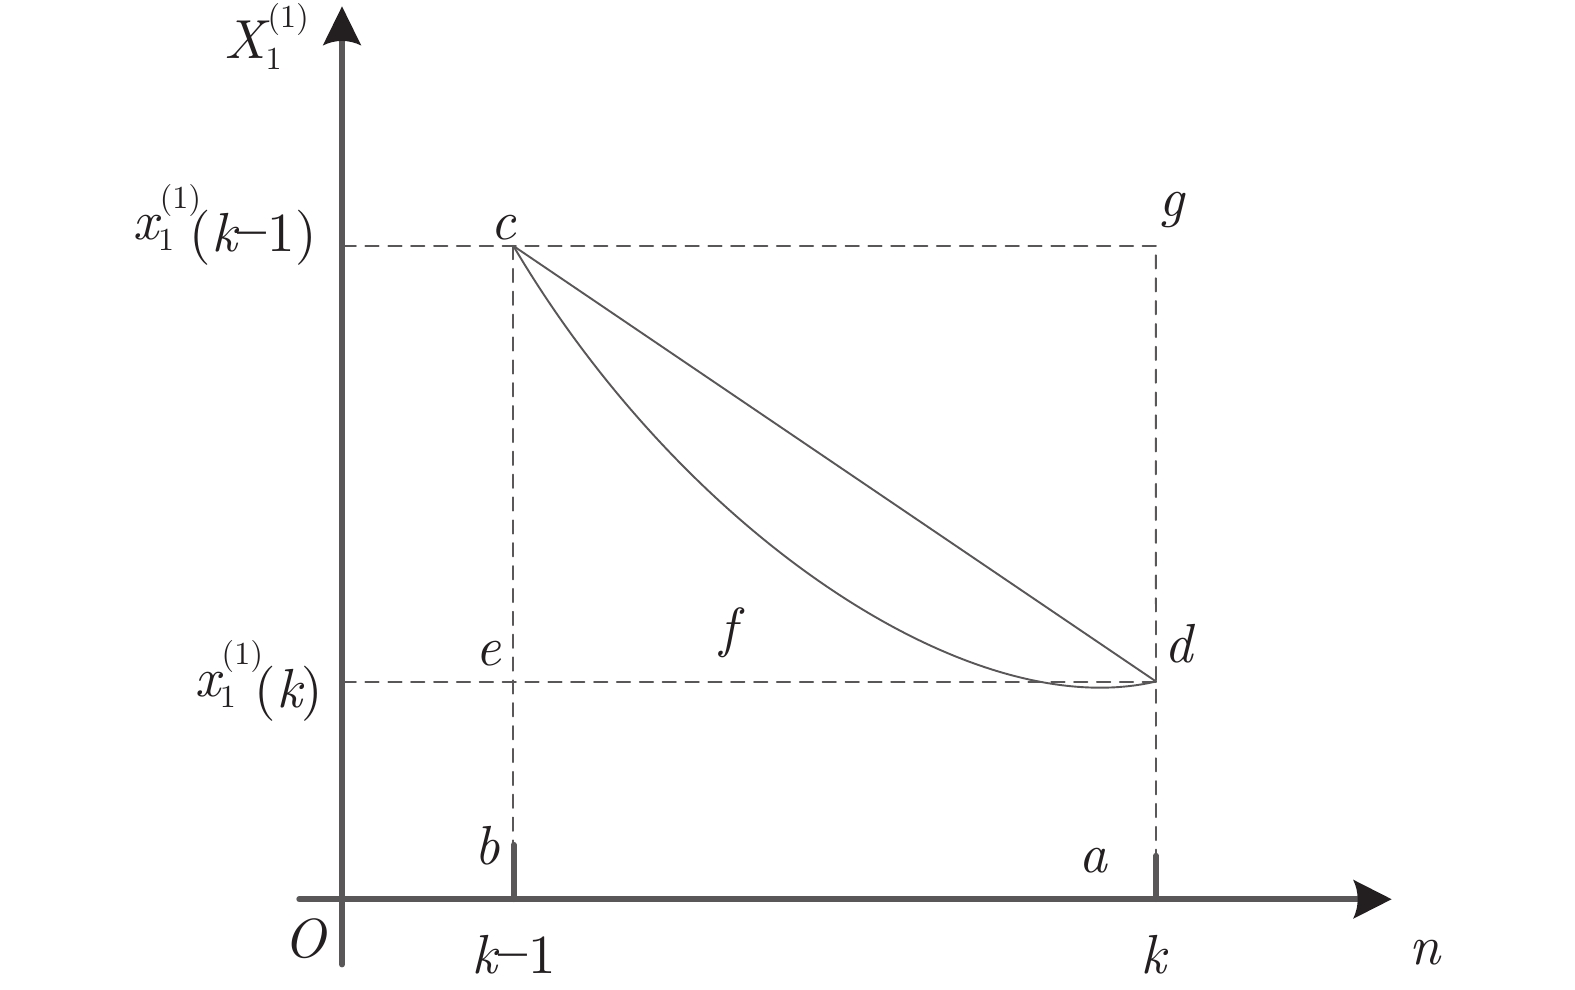
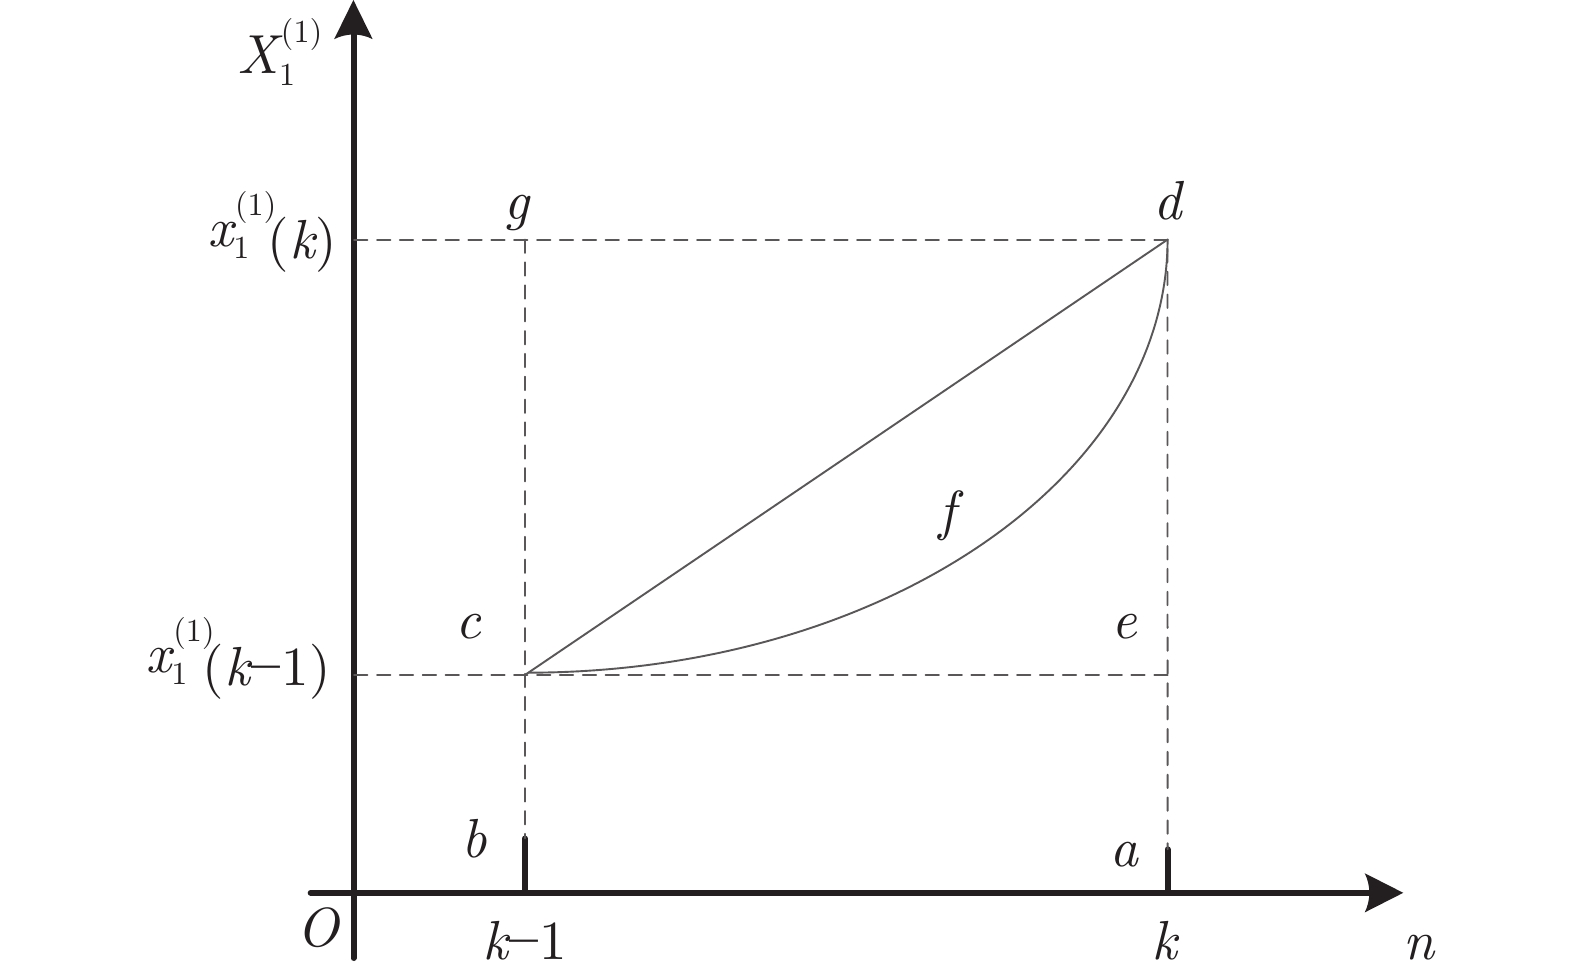
摘要: 现有的多变量灰色预测模型的背景值估计误差及模型结构单一是导致该模型预测性能不稳定的重要因素, 致使该模型在实际预测领域中应用并不广泛. 本文通过分析背景值函数的几何意义, 结合积分几何面积公式, 提出一种改进的背景值优化方法, 使预测模型在背景值系数的选取上更加灵活.在此基础上, 模型中加入灰色作用量, 提出一种改进背景值及结构相容性的多维灰色预测模型(Improved background value and structure compatibility of grey prediction model, IBSGM(1, N)). 通过对模型参数的改变分析, 新模型理论上可达到与传统单变量和多变量灰色预测模型的兼容性. 为检验新模型的性能, 本文进行了三个案例对比分析, 实验结果表明, 与现有的灰色预测模型(Grey model, GM) GM(1, 1)和GM(1, N)相比较, 所提出的IBSGM(1, N)模型在背景值参数估计上误差明显减小, 结构相容性更强, 泛化性能更好, 具有更高的预测精度.
-
关键词:
- 背景值优化 /
- 结构相容性 /
- 多维灰色预测模型 /
- IBSGM(1, N)
Abstract: The background value estimation error of the existing multivariate gray prediction model and the single model structure are important factors that lead to the unstable prediction performance of the model. Therefore, the model is not widely used in the actual prediction field. In this paper, by analyzing the geometric meaning of the background value function, combined with the integral geometric area formula, an improved background value optimization method is proposed to make the prediction model more flexible in the selection of background value coefficients. On this basis, the gray effect is added to the model, and a new multi-dimensional gray prediction model called improved background value and structure compatibility of grey prediction model (IBSGM(1, N)) is proposed. Through the analysis of the change of model parameters, the new model can theoretically achieve compatibility with traditional univariate and multivariate gray prediction models. In order to test the performance of the new model, this paper conducts a comparative analysis of three cases. The experimental results show that compared with the existing grey prediction model (GM) GM(1, 1) and GM(1, N), the proposed IBSGM(1, N) model has significantly reduced error in background parameter estimation, stronger structural compatibility, better generalization performance, and higher prediction accuracy.1) 收稿日期 2020-09-21 录用日期 2020-12-31 Manuscript received September 21, 2020; accepted December31, 2020 国家重点研发计划重点专项 (2018YFC0808100), 国家自然科学基金 (61976218, 61973306), 江苏省高等学校自然科学研究项目(19KJB440002), 江苏省自然科学基金(BK20200086), 中央高校基本科研业务费专项资金资助 (2020ZDPY0303) 资助 Supported by Project of National Key Research and Development Project (2018YFC0808100), National Natural Science Foundation of China (61976218, 61973306), Natural Science Research Project of Higher Education Institutions in Jiangsu Province (19KJB440002), Natural Science Foundation of Jiangsu Provinces (BK20200086), Fundamental Research Fund for the Central Universities (2020ZDPY0303) 本文责任编委 吕宜生 Recommended by Associate Editor LV Yi-Sheng2) 1. 中国矿业大学信息与控制工程学院 徐州 221116 2. 宿迁学院机电工程学院 宿迁 223800 1. School of Information and Control Engineering, China University of Mining and Technology, Xuzhou 221116 2. School of Mechanical and Electrical Engineering of Suqian College, Suqian 223800 -
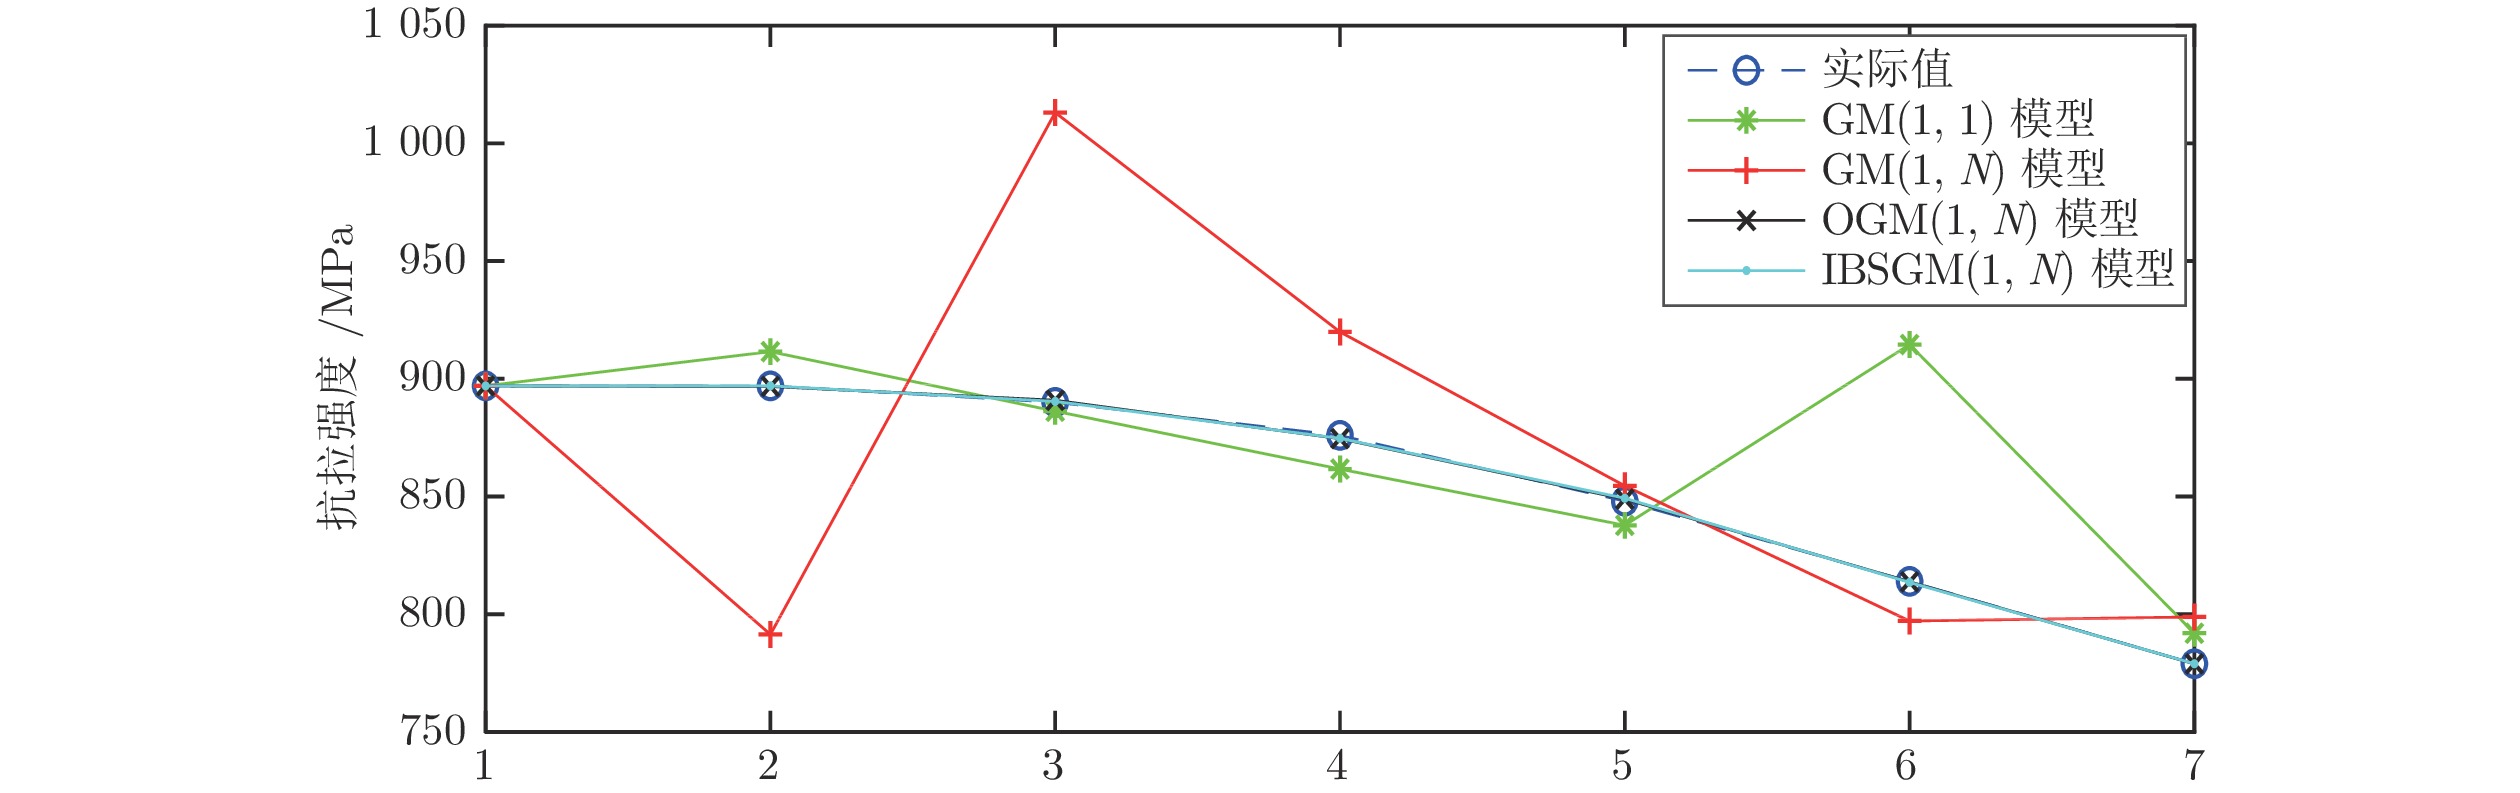
图 3 例1中四种模型的模拟预测结果曲线图
Fig. 3 Curves of simulated prediction results of the four models in Example 1

图 4 例2中四种模型的模拟预测结果曲线图
Fig. 4 Curves of simulation prediction results of the four models in Example 2
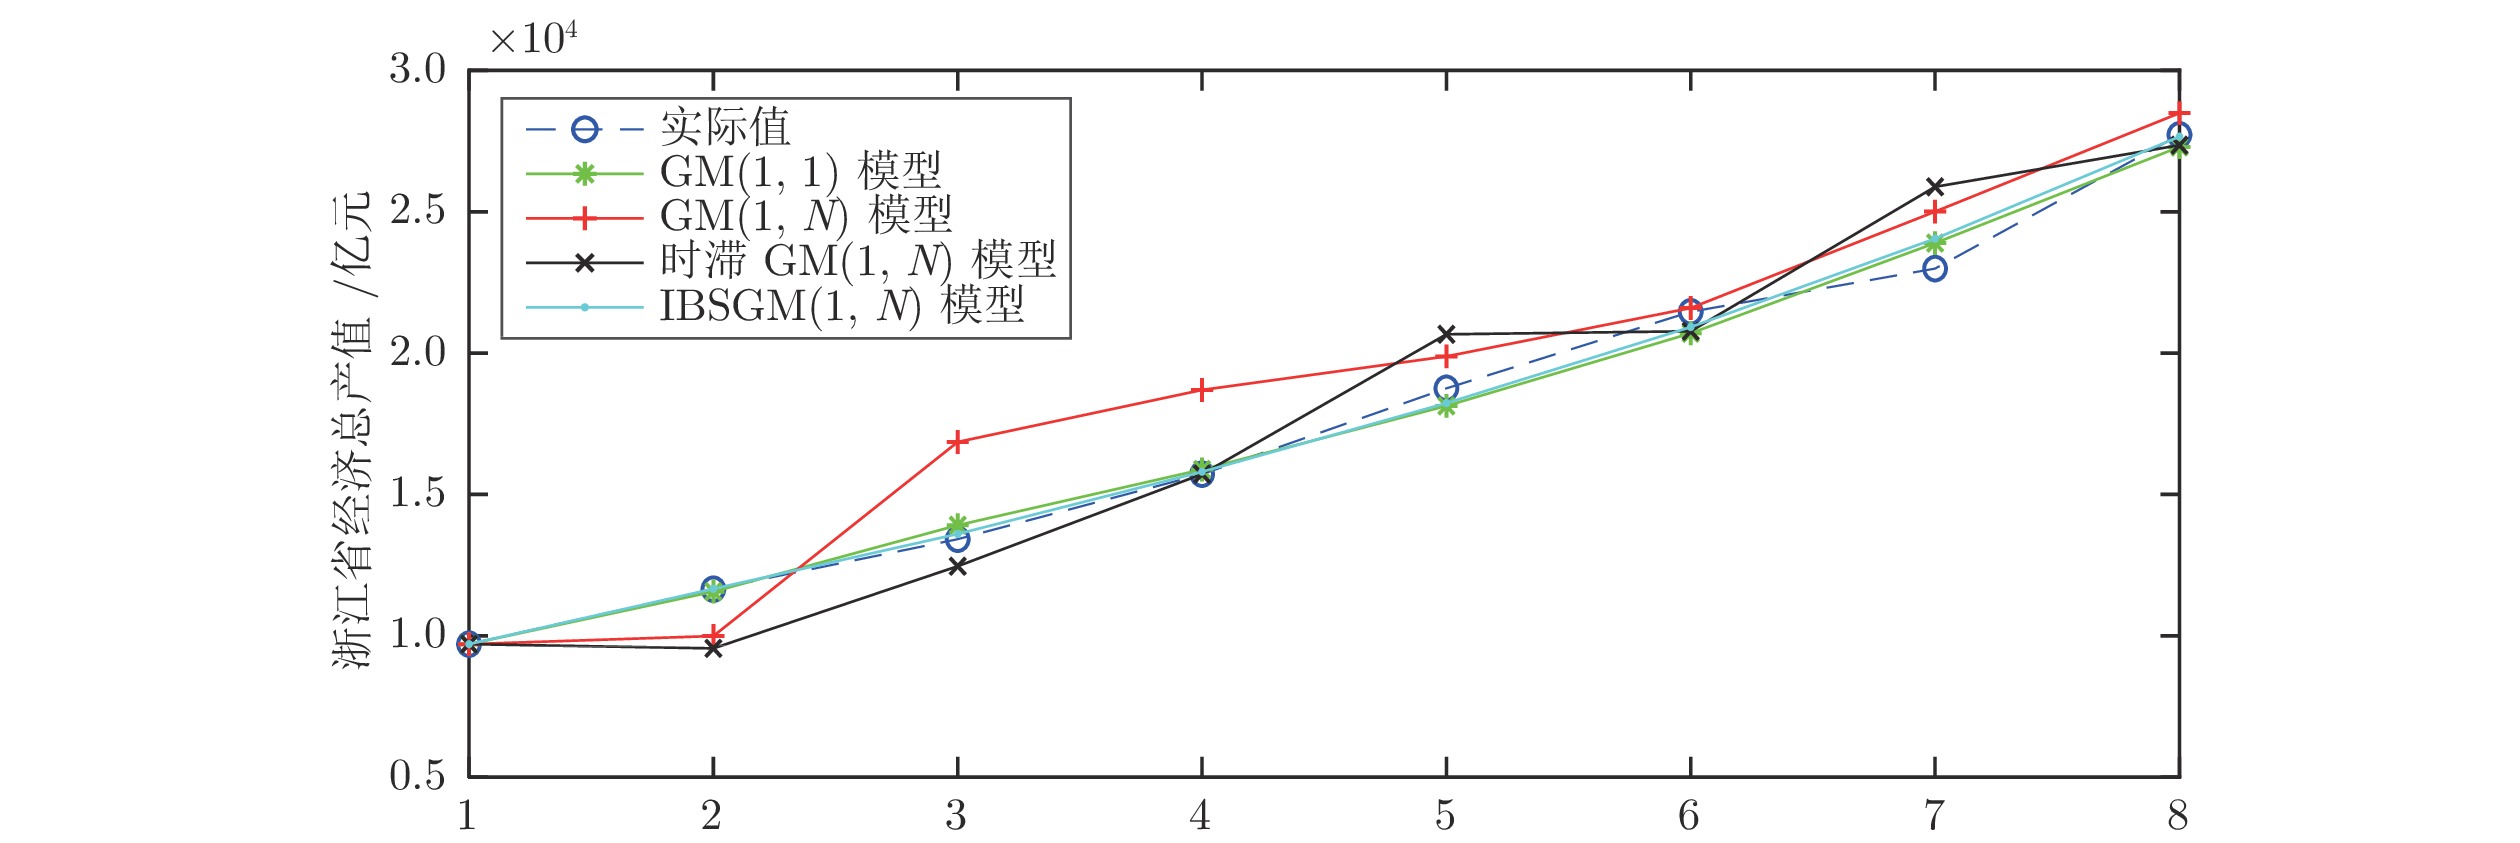
图 5 例3中四种模型的模拟预测结果曲线图
Fig. 5 Curves of simulation prediction results of the four models in Example 3
表 1 寸草塔煤矿日均瓦斯浓度及影响因素
Table 1 Daily average gas concentration and influencing factors in Cuncaota Coal Mine
序号 X1(0) X2(0) X3(0) X4(0) 1 0.34 0.34 21.7 0.34 2 0.34 0.29 18.1 0.36 3 0.26 0.29 25.3 0.31 4 0.26 0.41 21.4 0.33 5 0.23 0.51 25.3 0.28 6 0.22 0.37 22.3 0.29 7 0.21 0.38 23.2 0.23 8 0.17 0.41 22.5 0.35 9 0.17 0.36 24.1 0.19 10 0.16 0.48 22.9 0.25  下载: 导出CSV
表 2 IBSGM(1, N)与GM(1, N)模型预测模拟值误差对比
Table 2 Comparison of prediction and simulation errors between IBSGM(1, N) and GM(1, N) model
实际值 0.34 0.34 0.26 0.26 0.23 0.22 0.21 0.17 0.17 0.16 平均误差 GM(1, N) 0.34 0.259 0.364 0.367 0.188 0.269 0.135 0.347 0.054 0.113 0.38 IBSGM(1, N) 0.34 0.33 0.27 0.25 0.247 0.219 0.204 0.173 0.16 0.165 0.0337
下载: 导出CSV
表 3 一种热处理钢在400℉至1100℉的抗拉强度及布氏硬度
Table 3 The tensile strength and Brinell hardness of a heat-treated steel from 400°F to 1100°F
序号 X1(0) X2(0) X3(0) 1 897 514 400 2 897 495 500 3 890 444 600 4 876 401 700 5 848 352 800 6 814 293 900 7 779 269 1000 8 738 235 1100
下载: 导出CSV
表 4 IBSGM(1, N)模型的参数值
Table 4 Parameter values of IBSGM(1, N) model
$ a $ $ {b}_{1} $ $ {b}_{2} $ $ \gamma $ $ \lambda $ 0.1711 0.2974 0.0247 728.1782 0
下载: 导出CSV
表 5 四种模型下预测结果和误差对比
Table 5 Comparison of prediction results and errors under the four models
序号 原始数据 IBSGM(1, N)模型 OGM(1, N)模型 GM(1, N)模型 GM(1, 1)模型 模拟值 相对误差 模拟值 相对误差 模拟值 相对误差 模拟值 相对误差 1 897 897 0 897 0 897 0 897 0 2 897 897.013 0.0015% 896.782 0.0243% 791.446 11.7674% 911.544 1.6214% 3 890 890.421 0.0473% 890.882 0.0991% 1013.103 13.8317% 886.265 0.4197% 4 876 874.707 0.1476% 874.589 0.1611% 919.923 5.0140% 861.687 1.6340% 5 848 849.283 0.1513% 848.921 0.1086% 854.567 0.7744% 837.790 1.2040% 6 814 813.571 0.0527% 813.797 0.0250% 797.161 2.0686% 914.556 0.0683% 7 779 779.005 0.0007% 778.952 0.0062% 798.870 2.5507% 791.967 1.6646% 平均拟合误差 0.0573% 0.0606% 5.1438% 0.9446% 预测结果 预测值 相对误差 预测值 相对误差 预测值 相对误差 预测值 相对误差 8 738 735.263 0.3709% 742.147 0.5619% 787.425 6.6972% 770.004 4.3366%
下载: 导出CSV
表 6 中国无线通信用户数量和相关因素
Table 6 Number of wireless communication users and related factors in China
序号 X1(0) X2(0) X3(0) X4(0) X5(0) 1 8453.3 13985.6 99241.6 563.5498 17825.6 2 14522.2 21926.3 109655.2 703.5769 25566.3 3 20600.5 27400.3 120322.7 773.01 28656.8 4 26995.3 33698.4 135822.8 869.3998 35082.5 5 33482.4 39684.3 159878.3 1262.998 42346.9 6 39340.6 48241.7 184937.4 1371.631 47196.1 7 46105.8 61032 216314.4 1442.343 50279.9 8 54730.6 85496.1 265810.3 1709.221 51034.6 9 64124.5 114531.4 314045.4 1690.719 50863.2 10 74721.4 144084.7 340902.8 1684.903 49265.6 11 85900.3 150284.9 401.202 1641.464 46537.3
下载: 导出CSV
表 7 IBSGM(1, N)模型的参数值
Table 7 Parameter values of IBSGM(1, N) model
$ a $ $ {b}_{1} $ $ {b}_{2} $ $ {b}_{3} $ $ {b}_{4} $ $ \gamma $ $ \lambda $ 0.5083 0.2095 −0.0067 0.7883 0.2811 −533.748 0
下载: 导出CSV
表 8 四种模型下预测结果和误差对比
Table 8 Comparison of prediction results and errors under the four models
序号 原始数据 IBSGM(1, N)模型 OBGM(1, N)模型 GM(1, N)模型 GM(1, 1)模型 模拟值 相对误差 模拟值 相对误差 模拟值 相对误差 模拟值 相对误差 1 8453.3 8453.3 0 8453.3 0 8453.3 0 8453.3 0 2 14522.2 14487.37 0.24% 14522.13 0 13547.07 6.71% 18836.59 29.71% 3 20600.5 20703.43 0.49% 20767.87 0.81% 26762.83 29.91% 22465.68 9.05% 4 26995.3 26927.63 0.25% 27021.5 0.10% 36603.21 35.59% 26793.96 0.75% 5 33482.4 33346.36 0.41% 33260.96 0.66% 44119.87 31.77% 31956.14 4.56% 6 39340.6 39540.97 0.51% 39664.41 0.82% 50502.83 28.37% 38112.87 3.12% 7 46105.8 46149.15 0.09% 46512.32 0.88% 57002.66 23.63% 45455.77 1.41% 8 54730.6 54533.32 0.36% 54578.75 0.28% 66192.81 20.94% 54213.37 0.95% 9 64124.5 64228.94 0.16% 64095.54 0.05% 77398.69 20.70% 64658.22 0.83% 10 74721.4 74706.12 0.02% 74999.45 0.37% 88385.60 18.29% 77115.40 3.20% 平均拟合误差 0.25% 0.4% 21.59% 5.36% 预测结果 预测值 相对误差 预测值 相对误差 预测值 相对误差 预测值 相对误差 11 85900.3 86179.62 0.32% 85586.72 0.37% 95722.40 11.43% 91972.60 7.07%
下载: 导出CSV
表 9 2003-2011年浙江省经济总产值与固定资产投资额
Table 9 2003-2011 Zhejiang province′s total economic output value and fixed asset investment
序号 X1(0) X2(0) 1 9705.02 4180.38 2 11648.7 5384.38 3 13417.7 6138.39 4 15718.47 6964.28 5 18753.73 7704.9 6 21462.69 8550.71 7 22990.35 9906.46 8 27722.31 11451.98 9 32318.85 14077.25
下载: 导出CSV
表 10 IBSGM(1, N)模型的参数值
Table 10 Parameter values of IBSGM(1, N) model
$ a $ $ {b}_{1} $ $ \gamma $ $ \lambda $ 0.0048 0.3268 8.6375 1
下载: 导出CSV
表 11 四种模型下预测结果和误差对比
Table 11 Comparison of prediction results and errors under the four models
序号 原始数据 IBSGM(1, N)模型 时滞GM(1, N)模型 GM(1, N)模型 GM(1, 1)模型 模拟值 相对误差 模拟值 相对误差 模拟值 相对误差 模拟值 相对误差 1 9705.02 9705.02 0 9705.02 0 9705.02 0 9705.02 0 2 11648.7 11660.78 0.10% 9554.96 17.97% 9991.74 20.43% 11562.08 0.74% 3 13417.7 13602.45 1.38% 12461.41 7.13% 16856.45 33.23% 13911.74 3.68% 4 15718.47 15802.97 0.54% 15718.47 0.00% 18698.06 10.94% 15882.74 1.05% 5 18753.73 18230.98 2.79% 20665.31 10.19% 19884.38 2.99% 18133.00 3.31% 6 21462.69 20922.41 2.52% 20773.85 3.21% 21595.31 8.91% 20702.07 3.54% 7 22990.35 24049.57 4.61% 25883.56 12.58% 25006.36 8.77% 23892.54 3.92% 8 27722.31 27659.11 0.23% 27355.39 1.32% 28491.67 2.78% 27293.70 1.55% 平均拟合误差 1.52% 6.55% 11.01% 2.22% 预测结果 预测值 相对误差 预测值 相对误差 预测值 相对误差 预测值 相对误差 9 32318.85 32104.52 0.66% 31523.81 2.46% 34864.8 7.88% 31179.03 3.53%
下载: 导出CSV
-
[1] 刘思峰, 党耀国, 方志耕, 等. 灰色系统理论及其应用. 第五版. 北京: 科学出版社, 2010. 3−4Liu Si-Feng, Dang Yao-Guo, Fang Zhi-Geng, et al. Gray system theories and its applications. Fifth Edition. Beijing: Science Press, 2010. 3−4 [2] 张熙来, 赵俭辉, 蔡波. 针对PM2.5单时间序列数据的动态调整预测模型. 自动化学报, 2018, 44(10): 1790-1798.Zhang Xi-Lai, Zhao Jian-Hui, Cai Bo. Prediction model with dynamic adjustment for single time series of PM2.5. Acta Automatica Sinica, 2018, 44(10): 1790-1798. [3] Ding S, A novel discrete grey multivariable model and its application in forecasting the output value of China’s high-tech industries, Computers & Industrial Engineering, 2019, 127, 749–760. [4] 陈宁, 彭俊洁, 王磊, 郭宇骞, 桂卫华. 模糊灰色认知网络的建模方法及应用. 自动化学报, 2018, 44(7): 1227-1236.Chen Ning, Peng Jun-Jie, Wang Lei, Guo Yu-Qian, Gui Wei-Hua. Fuzzy grey cognitive networks modeling and its application. Acta Automatica Sinica, 2018, 44(7): 1227-1236. [5] Xie N M, Liu S F. Discrete grey forecasting model and its optimizationl. Applied Mathematical Modelling, 2009, 33(2): 1173-1186. doi: 10.1016/j.apm.2008.01.011 [6] 李鹏, 刘思峰. 基于灰色关联分析和D-S证据理论的区间直觉模糊决策方法. 自动化学报, 2011, 37(8): 993-998.Li Peng, Liu Si-Feng. Interval-valued intuitionistic fuzzy numbers decision-making method based on grey incidence analysis and D-S theory of evidence. Acta Automatica Sinica, 2011, 37(8): 993-998. [7] Ma X, Liu Z B, Wang Y. Application of a novel nonlinear multivariate grey Bernoulli model to predict the tourist income of China, Journal of Computational and Applied Mathematics. 2019, 347, 84–94. doi: 10.1016/j.cam.2018.07.044 [8] Zeng B, Luo C, Liu S, Bai Y, Li C. Development of an optimization method for the GM(1, N) model. Engineering Applications of Artificial Intelligence, 2016, 55(oct.): 353-362. [9] Xiao X, Cheng S. Research on multicollinearity in the grey GM(1,N) model. Journal of Grey System, 2018, 30(4): 60-77. [10] Guo J, Xiao X, Yang J, Sun Y. GM(1,1) model considering the approximate heteroscedasticity. Journal of Grey System. 2017, 29, 53-66. [11] 蒋诗泉, 刘思峰, 周兴才. 基于复化梯形公式的GM(1,1) 模型背景值的优化. 控制与决策, 2014, 29(12): 2221-2225.Jiang Shi-Quan, Liu Si-Feng, Zhou Xing-Cai. Optimization of background value of GM(1,1) model based on complex trapezoidal formula. Control and Decision, 2014, 29(12): 2221-2225. [12] Wang Y H, Liu Q, Tang J R, Cao W B, Li X Z. Optimization approach of background value and initial item for improving prediction precision of GM(1,1) model. Journal of Systems Engineering and Electronics, 2014, 25(1): 77-82. doi: 10.1109/JSEE.2014.00009 [13] Zeng B, Li C. Improved multi-variable grey forecasting model with a dynamic background-value coefficient and its application. Computers & Industrial Engineering, 2018, 118(APR.): 278-290. [14] Luo Y, Liu Q. The non-homogenous multi-variable grey model NFMGM(1,n) with fractional order accumulation and its application. Journal of Grey System. 2017, 29, 39-52. [15] Luo Y X, Liu Q Y, The non-homogenous multi-variable grey model NFMGM(1,n) with fractional order accumulation and its application, Journal of Grey System. 2017, 29: 39–52. [16] 丁松, 党耀国, 徐宁, 朱晓月. 基于驱动因素控制的DFCGM(1,N)及其拓展模型构建与应用. 控制与决策, 2018, 33(4): 712-718.Ding Song, Dang Yao-Guo, Xu Ning, Zhu Xiao-Yue. Modelling and applications of DFCGM(1,N) and its extended model based on driving factors control, Control and Decision. 2018, 33 (4): 712–718. [17] Wei B L, Xie N M, Yang Y J. Data-based structure selection for unified discrete grey prediction model. Expert Systems with Application, 2019, 136: 264-275. doi: 10.1016/j.eswa.2019.06.053 [18] Zeng B, Duan H, Zhou Y. A new multivariable grey prediction model with structure compatibility. Applied Mathematical Modelling, 2019, 75: 385-397. doi: 10.1016/j.apm.2019.05.044 [19] 刘思峰, 杨英杰, 吴利丰等. 灰色系统理论及其应用[M]. 第七版. 北京: 科学出版社, 2014.1-2Liu Si-Feng, Yang Ying-Jie, Wu Li-Feng, et al. Grey System Theory and Its Application. Seventh Edition. Beijing: Science Press, 2014.1-2 [20] Luo Y, Liu Q. Multivariable non-equidistance grey model with fractional order accumulation and its application. Multivariable non-equidistance grey model with fractional order accumulation and its application. 2018, 30, 239-248. [21] 陈帅. 寸草塔煤矿回采工作面上隅角瓦斯涌出浓度预测研究[J]. 陕西煤炭, 2019, 38(02): 21-24.Chen Shuai. Study on the prediction of gas emission concentration at the upper corner of the working face in Cuncaota Coal Mine. Shaanxi Coal, 2019, 38(02): 21-24. [22] Zeng B, Luo C, Liu S, et al. Development of an optimization method for the GM(1, N) model. Engineering Applications of Artificial Intelligence, 2016, 55(oct.): 353-362. [23] 张可. 基于驱动控制的多变量离散灰色模型. 系统工程理论与实践, 2014, 34(8): 2084-2091. doi: 10.12011/1000-6788(2014)8-2084Zhang Ke. Multi-variables discrete grey model based on driver control. Systems Engineering-Theory & Practice, 2014, 34(8): 2084–209. doi: 10.12011/1000-6788(2014)8-2084 [24] 王正新. 多变量时滞GM(1,N)模型及其应用. 控制与决策, 2015, 30(12): 2298-2304.Wang Zheng-Xin. Multivariable time-delay GM(1,N) model and its application. Control and Decision, 2015, 30(12): 2298-2304. -

 下载:
下载:

计量
- 文章访问数: 1257
- HTML全文浏览量: 577
- PDF下载量: 191
- 被引次数: 0
