

Combining Domain Knowledge with Statistical Factor Analysis: An Application to Financial Risk Modeling
-
摘要: 因子分析是一种在工业领域广泛使用的统计学方法. 在金融资产管理中, 因子分析通过对历史价格波动的极大似然估计推导自适应的统计学因子来生成风险模型. 与通过使用预先设定具有经济学含义的因子来生成风险模型的基本面因子模型相比, 通过因子分析生成的模型不仅更灵活, 还能发现在基本面模型中缺失的因子. 然而, 由于因子分析所生成模型中的统计学因子缺少可解释性, 因此当金融数据中存在显著噪音时容易过拟合. 针对中国股市数据的风险模型生成问题, 本文提出快速因子分析算法以及将基本面因子结合到因子分析中的挑选基本面因子的混合因子分析方法, 使风险模型同时在因子探索及模型可解释性上达到最优. 实验结果显示快速因子分析方法能够达到31倍以上的加速比, 且新混合因子分析方法能够增大人造数据集以及真实数据集上预测的对数似然估计值. 在真实数据集上, 新方法能最好够达到平均对数似然估计值12.00, 比因子分析构建模型的7.56大4.44, 并且两个算法均值差值的标准差为1.58, 表现出新方法能构建更准确的风险模型.Abstract: Factor analysis is a statistical method widely used in many industrial domains. In financial portfolio management, a statistical risk model can be constructed via factor analysis, decomposing the risk into self-adapting factors and maximizing log-likelihood of the historical price movement. Compared to a fundamental model that uses well defined factors with economical meanings, it is more dynamic and may discover factors that are missed in the fundamental ones. On the other hand, statistical factors lack the intuitive interpretation, and thus are less stable and more prone to overfitting especially for the financial data with remarkable noises. In this work, we propose a fast factor analysis and a hybrid method that incorporates the fundamental factors into the statistical process, achieving an optimized combination of model interpretability and data exploitation. Our experiment results show that the acceleration of fast factor analysis is up to more than 31 times, and the new hybrid method yields improved out-of-sample log-likelihood on both synthetic and real-world data. The best mean of log-likelihood of proposed algorithm on real-world data is 12.00, which is larger than 7.56 of factor analysis with difference 4.44, and the standard deviation of the difference is 1.58. All the results shows the proposed algorithms estimate risk model more accurately.
-
Key words:
- Factor analysis /
- fundamental factor /
- domain knowledge /
- risk model /
- expectation-maximization process
-
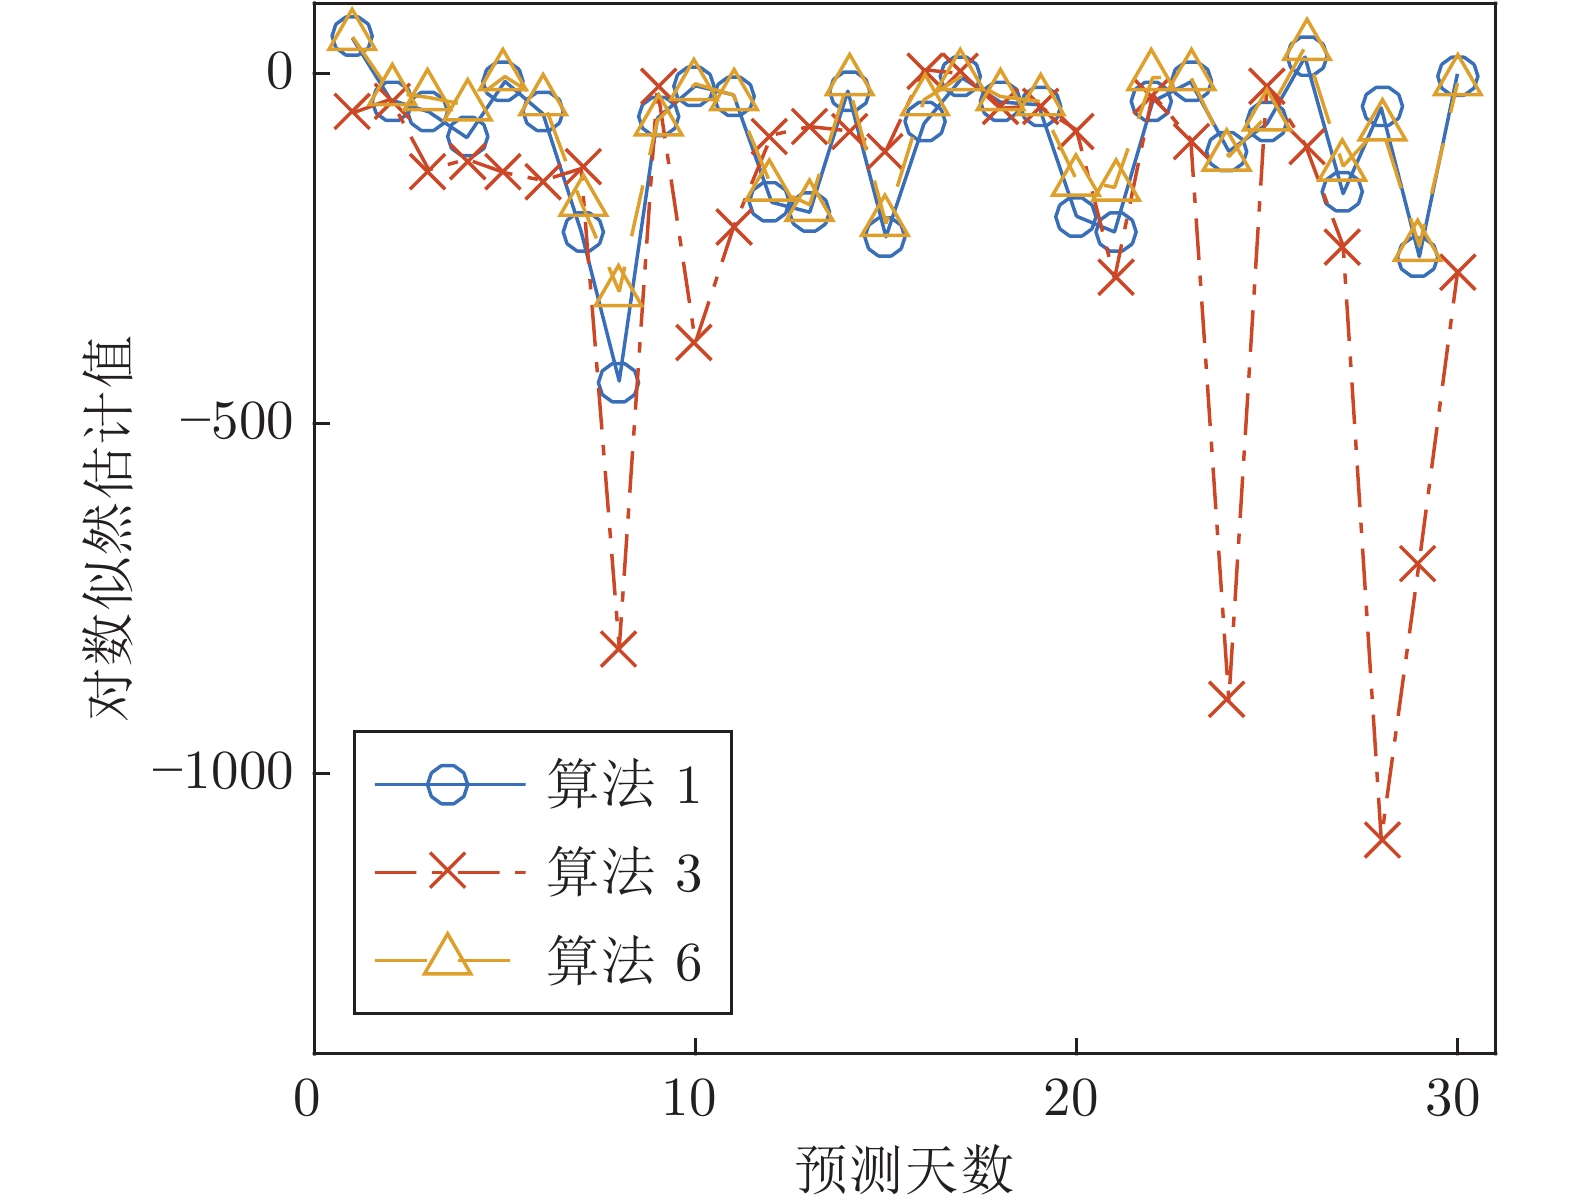
图 1 算法1、算法3和算法6
$(r = 0.9)$ 前30天风险模型在真实数据集上预测的对数似然估计值的结果Fig. 1 The predicted log-likelihood of the risk models estimated by Alg.1, Alg.3 and Alg.6
$(r = 0.9)$ on first 30 days表 1 算法1和算法2在第一个人造数据集上的实验结果
Table 1 Results on first synthetic dataset of Alg.1 and Alg.2
因子数 算法 $\delta=5$ $\delta=10$ 时间 (s) ${\rm E}\,(LL)$ $\sigma\,({\rm E})$ ${\rm E}\,(iter)$ 加速比 时间 (s) $ {\rm E}\,(LL)$ $\sigma\,( {\rm E})$ $ {\rm E}\,(iter)$ 加速比 $s=10$ 算法1 (FA) 444.21 −1927.63 10.01 709.02 — 252.07 −2059.10 6.30 405.51 — $s=10$ 算法2 (FFA) 14.05 −1927.63 10.01 709.01 31.6 7.80 −2059.10 6.30 405.55 32.3 $s=13$ 算法1 (FA) 653.60 −1861.02 11.48 1019.66 — 313.86 −2027.42 6.29 492.91 — $s=13$ 算法2 (FFA) 20.38 −1863.73 11.39 1020.77 32.1 9.58 −2027.08 6.24 492.79 32.8  下载: 导出CSV
表 2 算法1、算法2、算法3和算法4在第二个人造数据集上的实验结果
Table 2 Results on second synthetic dataset of Alg.1, Alg.2, Alg.3 and Alg.4
因子数 算法 $\delta=3$ $\delta=5$ $\delta=10$ 时间 (s) ${\rm E}\,(LL)$ $\sigma\,( {\rm E})$ 时间 (s) $ {\rm E}\,(LL)$ $\sigma\,( {\rm E})$ 时间 (s) $ {\rm E}\,(LL)$ $\sigma\,( {\rm E})$ $s=10,f=0$ 算法1 (FA) 484.94 −3789.03 28.85 389.27 −3866.59 24.26 227.39 −4116.68 14.46 $s=10,f=0$ 算法2 (FFA) 207.17 −3789.02 28.85 171.58 −3866.60 24.65 99.19 −4116.68 14.46 $s=0,f=10$ 算法3 (OLS) 0.23 −3734.41 22.60 0.23 −3815.23 19.05 0.23 −4072.60 11.39 $s=13,f=0$ 算法1 (FA) 779.07 −3617.34 33.82 562.08 −3732.61 25.96 279.78 −4046.25 13.46 $s=13,f=0$ 算法2 (FFA) 331.09 −3616.64 33.72 247.17 −3731.49 26.16 121.48 −4045.92 13.46 $s=3,f=10$ 算法4 (HFA) 123.49 −3564.72 25.94 92.44 −3678.27 20.23 48.63 −4002.81 10.52
下载: 导出CSV
表 3 算法1、算法2、算法3、算法4及算法6在第三个人造数据集上的实验结果
Table 3 Results on third synthetic dataset of Alg.1, Alg.2, Alg.3, Alg.4 and Alg.6
因子数 算法 $\delta=3$ $\delta=5$ $\delta=10$ 时间 (s) $ {\rm E}\,(LL)$ $\sigma\,( {\rm E})$ 时间 (s) $ {\rm E}\,(LL)$ $\sigma\,( {\rm E})$ 时间 (s) $ {\rm E}\,(LL)$ $\sigma\,( {\rm E})$ $s=10,f=0$ 算法1 (FA) 693.57 −3594.51 26.64 507.47 −3709.94 20.81 263.41 −4019.67 10.86 $s=10,f=0$ 算法2 (FFA) 290.06 −3593.84 26.97 215.58 −3703.39 21.36 105.50 −4019.93 10.88 $s=0,f= 10$ 算法3 (OLS) 0.24 −3712.75 22.24 0.25 −3796.19 18.78 0.24 −4059.71 11.19 $s+f=10$ 算法6 (HFA+) 1726.79 −3561.04 25.26 1307.14 −3683.00 20.75 596.52 −4005.34 11.34 $s=13,f=0$ 算法1 (FA) 845.15 −3389.00 30.54 721.67 −3550.65 21.55 312.41 −3955.47 10.07 $s=13,f=0$ 算法2 (FFA) 351.61 −3389.82 30.89 304.29 −3549.53 21.45 123.93 −3955.47 10.07 $s=3,f=10$ 算法4 (HFA) 111.30 −3536.52 28.39 81.30 −3661.63 22.11 48.15 −3993.70 11.43 $s+f=13$ 算法6 (HFA+) 2314.11 −3378.86 32.36 1826.26 −3522.23 21.72 796.98 −3933.08 10.42
下载: 导出CSV
表 4 算法1、算法2、算法3和算法6在真实数据集上的实验结果比较
Table 4 Results on real-world dataset of Alg.1, Alg.2, Alg.3 and Alg.6
因子数 算法 $r$ 时间 (s) $ {\rm E}\,({LL})$ $\sigma\,( {\rm E})$ $ {\rm E}\,(LL_{Alg.6} - LL_{Alg.2})$ $\sigma( {\rm E}\,(LL_{Alg.6} - LL_{Alg.2}))$ $s=15, f=0$ 算法1 (FA) — 1.61 7.56 9.06 — — $s=15, f=0$ 算法2 (FFA) — 0.55 7.54 9.06 — — $s=0, f=22$ 算法3 (OLS) — 0.01 −108.0 15.50 — — $s+f=15$ 算法6 (HFA+) $0.6$ 10.82 11.96 8.18 4.40 1.64 $0.7$ 10.90 11.86 8.20 4.29 1.61 $0.8$ 10.40 11.77 8.24 4.21 1.58 $0.9$ 10.51 12.00 8.25 4.44 1.58
下载: 导出CSV
-
[1] Alexander C. Market Models: A guide to financial data analysis. John Wiley & Sons, 2001 [2] Alexander C. Market Risk Analysis, Practical Financial Econometrics. John Wiley & Sons, 2008 [3] MSCI Barra. Barra Risk Model Handbook. MSCI Barra Applied Research, 2007, 43 [4] Christoffersen P, Goncalves S. Estimation Risk in Financial Risk Management. CIRANO, 2004. [5] Christoffersen P, Diebold F. How relevant is volatility forecasting for financial risk management? Review of Economic and Statistics, 2000, 82(1): 12-22 doi: 10.1162/003465300558597 [6] Higgins R C, Reimers M. Analysis for Financial Management. Number 53. Irwin Chicago, 1995 [7] Smith C W, Smithson C W, Wilford D S. Managing Financial Risk. Irein Burr Ridge, 1995 [8] Connor G. The three types of factor models: A comparison of their explanatory power. Finanacial Analysis Journal, 1995, 51(3): 42-46 doi: 10.2469/faj.v51.n3.1904 [9] Boyer M M, Filion D. Common and fundamental factors in stock returns of Canadian oil and gas companies. Energy Economics, 2007, 29(3): 428-453 doi: 10.1016/j.eneco.2005.12.003 [10] Dechow P M, Hutton A P, Meubroek L, Sloan R G. Short-sellers, fundamental analysis, and stock returns. Journal of financial Economics, 2001, 61(1): 71-106 [11] Doshi-Velez F, Kim B. Towards a Rigorous science of interpretable machine learning. arXiv preprint arXiv: 1702.08608, 2017 [12] Molnar C. Interpretable Machine Learning: A guide for making black box models explainable [Online]. available: https://christophm.github.io/interpretable-ml-book, 2020 [13] Goodfellow I, Bengio Y, Courville A. Deep Learning. MIT press, 2016. [14] Dempster A P. Maximum likelihood from incomplete data via the EM algorithm. Journal of Royal Statistical Society, 1977, 39(1): 1-38 [15] Rubin D and Thayer D. EM algorithms for ML factor analysis Psychometrika, 1982, 47(1): 69-76 doi: 10.1007/BF02293851 [16] Ghahramani Z, Hinton G. The EM algorithm for mixtures of factor analyzers. Technical Report CRG-TR-96-1, University of Toronto, Canada, 1996 [17] Kaiser H. The application of electronic computers to factor analysis. Educational and Psychological Measurement, 1960, 20(1): 141-151 doi: 10.1177/001316446002000116 [18] Roweis S, Ghahramani Z. A unifying review of linear Gaussian models. Nueral Computation, 1999, 11(2): 305-345 doi: 10.1162/089976699300016674 [19] Saqib U, Gannot S, Jensen J R. Estimation of Acoustic Echoes Using Expectation-Maximization Methods. Eurasip Journal on Audio, Speech, and Music Processing, 2020, 2020(1): 1-15 doi: 10.1186/s13636-019-0169-5 [20] Sun Z, Yang Y. An EM Approach to Non-autoregressive Conditional Sequence Generation. In: Proceedings of the 37th International Conference on Machine Learning. arXiv: 2006.16378, 2020 [21] Nan Y, Quan Y, Jim H. Variational-EM-Based Deep Learning for Noise-Blind Image Deblurring. In: Proceedings of the 2020 IEEE/CVF Conference on Computer Vision and Pattern Recognition, 2020: 3626−3635 [22] 席燕辉, 彭辉, 莫红. 基于EM-EKF算法的RBF-AR模型参数估计. 自动化学报, 2017, 43(9): 1636-1643. doi: 10.16383/j.aas.2017.e160216Yanhui Xi, Hui Peng, Hong Mo. Parameter Estimation of RBF-AR Model Based on the EM-EKF Algorithm. Acta Automatica Sinica, 2017, 43(9): 1636-1643. doi: 10.16383/j.aas.2017.e160216 [23] 马新科, 杨扬, 杨昆, 罗毅. 基于模糊形状上下文与局部向量相似性约束的配准算法. 自动化学报, 2020, 46(2): 342-357. doi: 10.16383/j.aas.c180118MA Xin-Ke, YANG Yang, YANG Kun, LUO Yi. Registration Algorithm Based on Fuzzy Shape Context and Local Vector Similarity Constraint. Acta Automatica Sinica, 2020, 46(2): 342-357. doi: 10.16383/j.aas.c180118 [24] 姚红革, 董泽浩, 喻钧, 白小军. 深度EM胶囊网络全重叠手写数字识别与分离. 自动化学报, DOI: 10.16383/j.aas.c190849Yao Hong-Ge, Dong Ze-Hao, Yu Jun, Bai Xiao-Jun. Fully overlapped handwritten number recognition and separation based on deep EM capsule network. Acta Automatica Sinica, DOI: 10.16383/j.aas.c190849 [25] Thomposon B. Exploratory and confirmatory factor analysis: Under concepts and applications. American Psycholohical Association, 2004 [26] 郭武, 李轶杰, 戴礼荣, 王仁华. 说话人识别中的因子分析以及空间拼接. 自动化学报, 2009, 35(9): 1193-1198. doi: 10.3724/SP.J.1004.2009.01193Guo Wu, Li Yi-Jie, Dai Li-Rong, Wang Ren-Hua. Factor Analysis and Space Assembling in Speaker Recognition. Acta Automatica Sinica, 2009, 35(9): 1193-1198. doi: 10.3724/SP.J.1004.2009.01193 [27] Gonzalez J A, et al. A silent speech system based on permanent magnet articulography and direct synthesis. Computer Speech & Language, 2016, 39: 67-87 [28] Li Y, Dixit M, Vasconcelos N. Deep scene image classification with the MFAFVNet. In: Proceedings of the 2017 IEEE International Conference on Computer Vision, 2017: 5746−5754 [29] Kesteren E van, Kievit R A. Exploratory Factor Analysis with Structured Residuals for Brain Network Data. Network Neuroscience, 2020: 1-45 -


 下载:
下载:

计量
- 文章访问数: 1865
- HTML全文浏览量: 552
- PDF下载量: 186
- 被引次数: 0
