

-
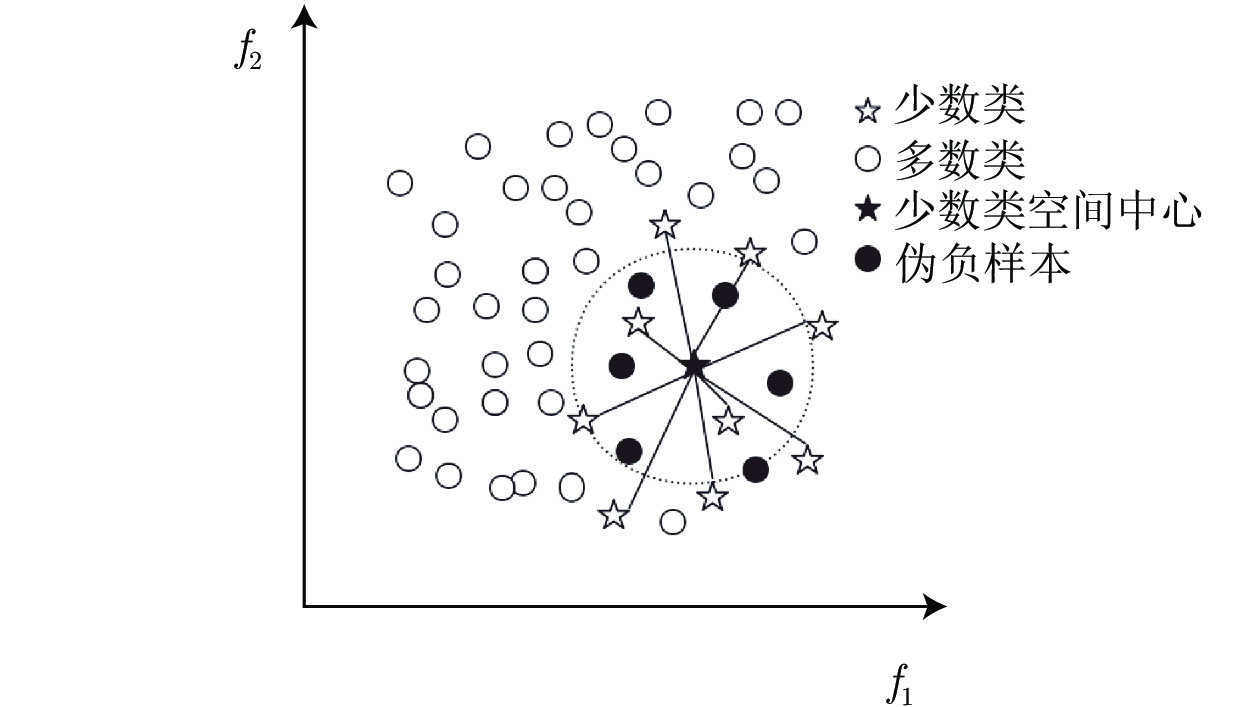
摘要: 不平衡数据是机器学习中普遍存在的问题并得到广泛研究, 即少数类的样本数量远远小于多数类样本的数量. 传统基于最小化错误率方法的不足在于: 分类结果会倾向于多数类, 造成少数类的精度降低, 通常还存在时间复杂度较高的问题. 为解决上述问题, 提出一种基于样本空间分布的数据采样方法, 伪负样本采样方法. 伪负样本指被标记为负样本(多数类)但与正样本(少数类)有很大相关性的样本. 算法主要包括3个关键步骤: 1)计算正样本的空间分布中心并得到每个正样本到空间中心的平均距离; 2)以同样的距离计算方法计算每个负样本到空间分布中心的距离, 并与平均距离进行比较, 将其距离小于平均距离的负样本标记为伪负样本; 3)将伪负样本从负样本集中删除并加入到正样本集中. 算法的优势在于不改变原始数据集的数量, 因此不会引入噪声样本或导致潜在信息丢失; 在不降低整体分类精度的情况下, 提高少数类的精确度. 此外, 其时间复杂度较低. 经过13个数据进行多角度实验, 表明伪负样本采样方法具有较高的预测准确性.Abstract: Data imbalance is a very common problem that has been comprehensively studied in machine learning techniques, where the minority class contains very few samples compared with the majority class. The disadvantage of traditional methods based on minimizing the error lies in: they tend to be biased toward the majority class, so these models have low prediction accuracy for the minority class and might have high time complexity. To solve the above problems, a data sampling method based on spatial distribution, Pseudo-negative sampling is proposed. Pseudo-negative samples refer to samples marked as negative samples (majority class) but with a strong correlation with positive samples (minority class). The algorithm mainly includes three key steps:1) calculate the spatial center of the positive samples and figure out the average distance of positive samples to the spatial center; 2) calculate the distance from each negative sample to the spatial center with similar distance calculation approach and compare it with the average distance, and then mark the negative sample as pseudo negative sample whose distance is less than the average distance; 3) delete the pseudo negative samples from the negative samples and add them to the positive sample set. The advantage of the algorithm is that it does not change the number of original data sets, so it does not introduce noise samples or cause potential information loss; the accuracy of a few classes can be improved without decreasing the overall classification accuracy and the time cost is low. Extensive experiments are conducted on thirteen datasets from multiple aspects, and the results show that the pseudo-negative sampling method has high prediction accuracy.
-
Key words:
- Imbalanced data /
- spatial distribution /
- machine learning /
- sampling method /
- spatial center
-
表 1 符号及说明
Table 1 Symbols and their explanations
名称 解释 $D^+,m$ 正样本集与正样本个数. 包含的样本表示为$D^{+}=\left\{\left(x^{+}_{1}, y^{+}_{1}\right),\left(x^{+}_{2}, y^{+}_{2}\right), \cdots,\left(x^{+}_{m}, y_{m}^{+}\right)\right\}$ $D^-,n$ 负样本集与负样本个数. 包含的样本表示为$D^{-}=\left\{\left(x^{-}_{1}, y^{-}_{1}\right),\left(x^{-}_{2}, y^{-}_{2}\right), \cdots,\left(x^{-}_{n}, y^{-}_{n}\right)\right\}$ $D^*$ 伪负样本集. 包含的样本表示为$D^{*}=\left\{\left(x^{*}_{1}, y^{*}_{1}\right),\left(x^{*}_{2}, y^{*}_{2}\right), \cdots,\left(x^{*}_{i}, y^{*}_{i}\right)\right\}$} $Q(x_{i})$ 样本$x_{i}$的相似性大小 ${{dist} }(x_1,x_2)$ 样本$x_1$与样本$x_2$间的欧氏距离 $C$ 正样本空间中心, 是所有正样本的平均值 $meanDist$ 将负样本判断为伪负样本的阈值, 其值是所有正样本到空间中心 C 的平均距离  下载: 导出CSV
表 2 不平衡数据集信息
Table 2 Information of the imbalanced dataset
来源 数据集 样本数 特征数 比例 特征属性 (连续/离散) 真实数据 SPECT 267 44 4 44/0 SNP 3074 25 16 25/0 UCI 数据 Ecoli 336 7 8.6 7/0 SatImage 6435 36 9.3 0/36 Abalone 4177 8 9.7 6/2 Balance 625 4 11.7 0/4 SolarFlare 1389 10 19 0/10 Yeast_ME2 1484 8 28 8/0 Abalone_19 4177 8 130 6/2 KEEL 数据 Yeast1289vs7 947 8 30.6 8/0 Yeast1458vs7 693 8 22.1 8/0 Yeast4 1484 8 28.1 8/0 Yeast5 1484 8 32.7 8/0
下载: 导出CSV
表 3 分类混淆矩阵
Table 3 The confuse matrix of classification
混淆矩阵 预测为正样本 预测为负样本 正样本 $TP$ $FN$ 负样本 $FP$ $TN$
下载: 导出CSV
表 4 伪负样本采样在分类器SVM、LR、DT、RF上的结果
Table 4 Results of pseudo-negative sampling on classifiers including SVM, LR, DT and RF
数据集 分类算法 $Sen$ $Spe$ $Acc$ $MCC$ F-score $AUC$ Balance SVM 0.810 0.967 0.911 0.804 0.860 0.967 LR 0.638 0.872 0.789 0.525 0.670 0.868 DT 0.885 0.950 0.928 0.836 0.889 0.920 RF 0.887 0.956 0.932 0.849 0.899 0.972 Ecoli SVM 0.826 0.975 0.952 0.806 0.828 0.982 LR 0.746 0.975 0.941 0.755 0.781 0.962 DT 0.741 0.961 0.932 0.704 0.734 0.865 RF 0.733 0.975 0.938 0.734 0.756 0.963 SatImage SVM 0.924 0.917 0.919 0.830 0.892 0.980 LR 0.823 0.827 0.825 0.636 0.772 0.913 DT 0.847 0.908 0.886 0.754 0.842 0.877 RF 0.901 0.950 0.933 0.854 0.906 0.984 Abalone SVM 0.906 0.994 0.965 0.922 0.945 0.966 LR 0.903 0.978 0.954 0.895 0.928 0.973 DT 0.914 0.949 0.937 0.860 0.906 0.932 RF 0.904 0.991 0.962 0.916 0.941 0.981 SolarFlare SVM 0.917 0.976 0.954 0.901 0.936 0.984 LR 0.934 0.962 0.951 0.896 0.934 0.973 DT 0.922 0.956 0.943 0.880 0.924 0.940 RF 0.942 0.957 0.951 0.897 0.935 0.987 Yeast_ME2 SVM 0.757 0.982 0.946 0.791 0.818 0.976 LR 0.573 0.966 0.902 0.608 0.653 0.947 DT 0.735 0.946 0.911 0.675 0.724 0.843 RF 0.723 0.976 0.935 0.749 0.782 0.968 Abalone_19 SVM 0.969 0.989 0.982 0.962 0.975 0.996 LR 0.971 0.984 0.979 0.956 0.971 0.997 DT 0.976 0.982 0.980 0.957 0.972 0.979 RF 0.977 0.992 0.987 0.972 0.982 0.997 SPECT SVM 0.767 0.907 0.862 0.682 0.774 0.941 LR 0.732 0.862 0.816 0.586 0.707 0.909 DT 0.627 0.817 0.753 0.440 0.608 0.732 RF 0.674 0.931 0.846 0.637 0.725 0.929 SNP SVM 0.677 0.980 0.850 0.709 0.795 0.966 LR 0.692 0.961 0.845 0.693 0.793 0.902 DT 0.892 0.911 0.903 0.803 0.888 0.902 RF 0.900 0.958 0.933 0.864 0.920 0.971
下载: 导出CSV
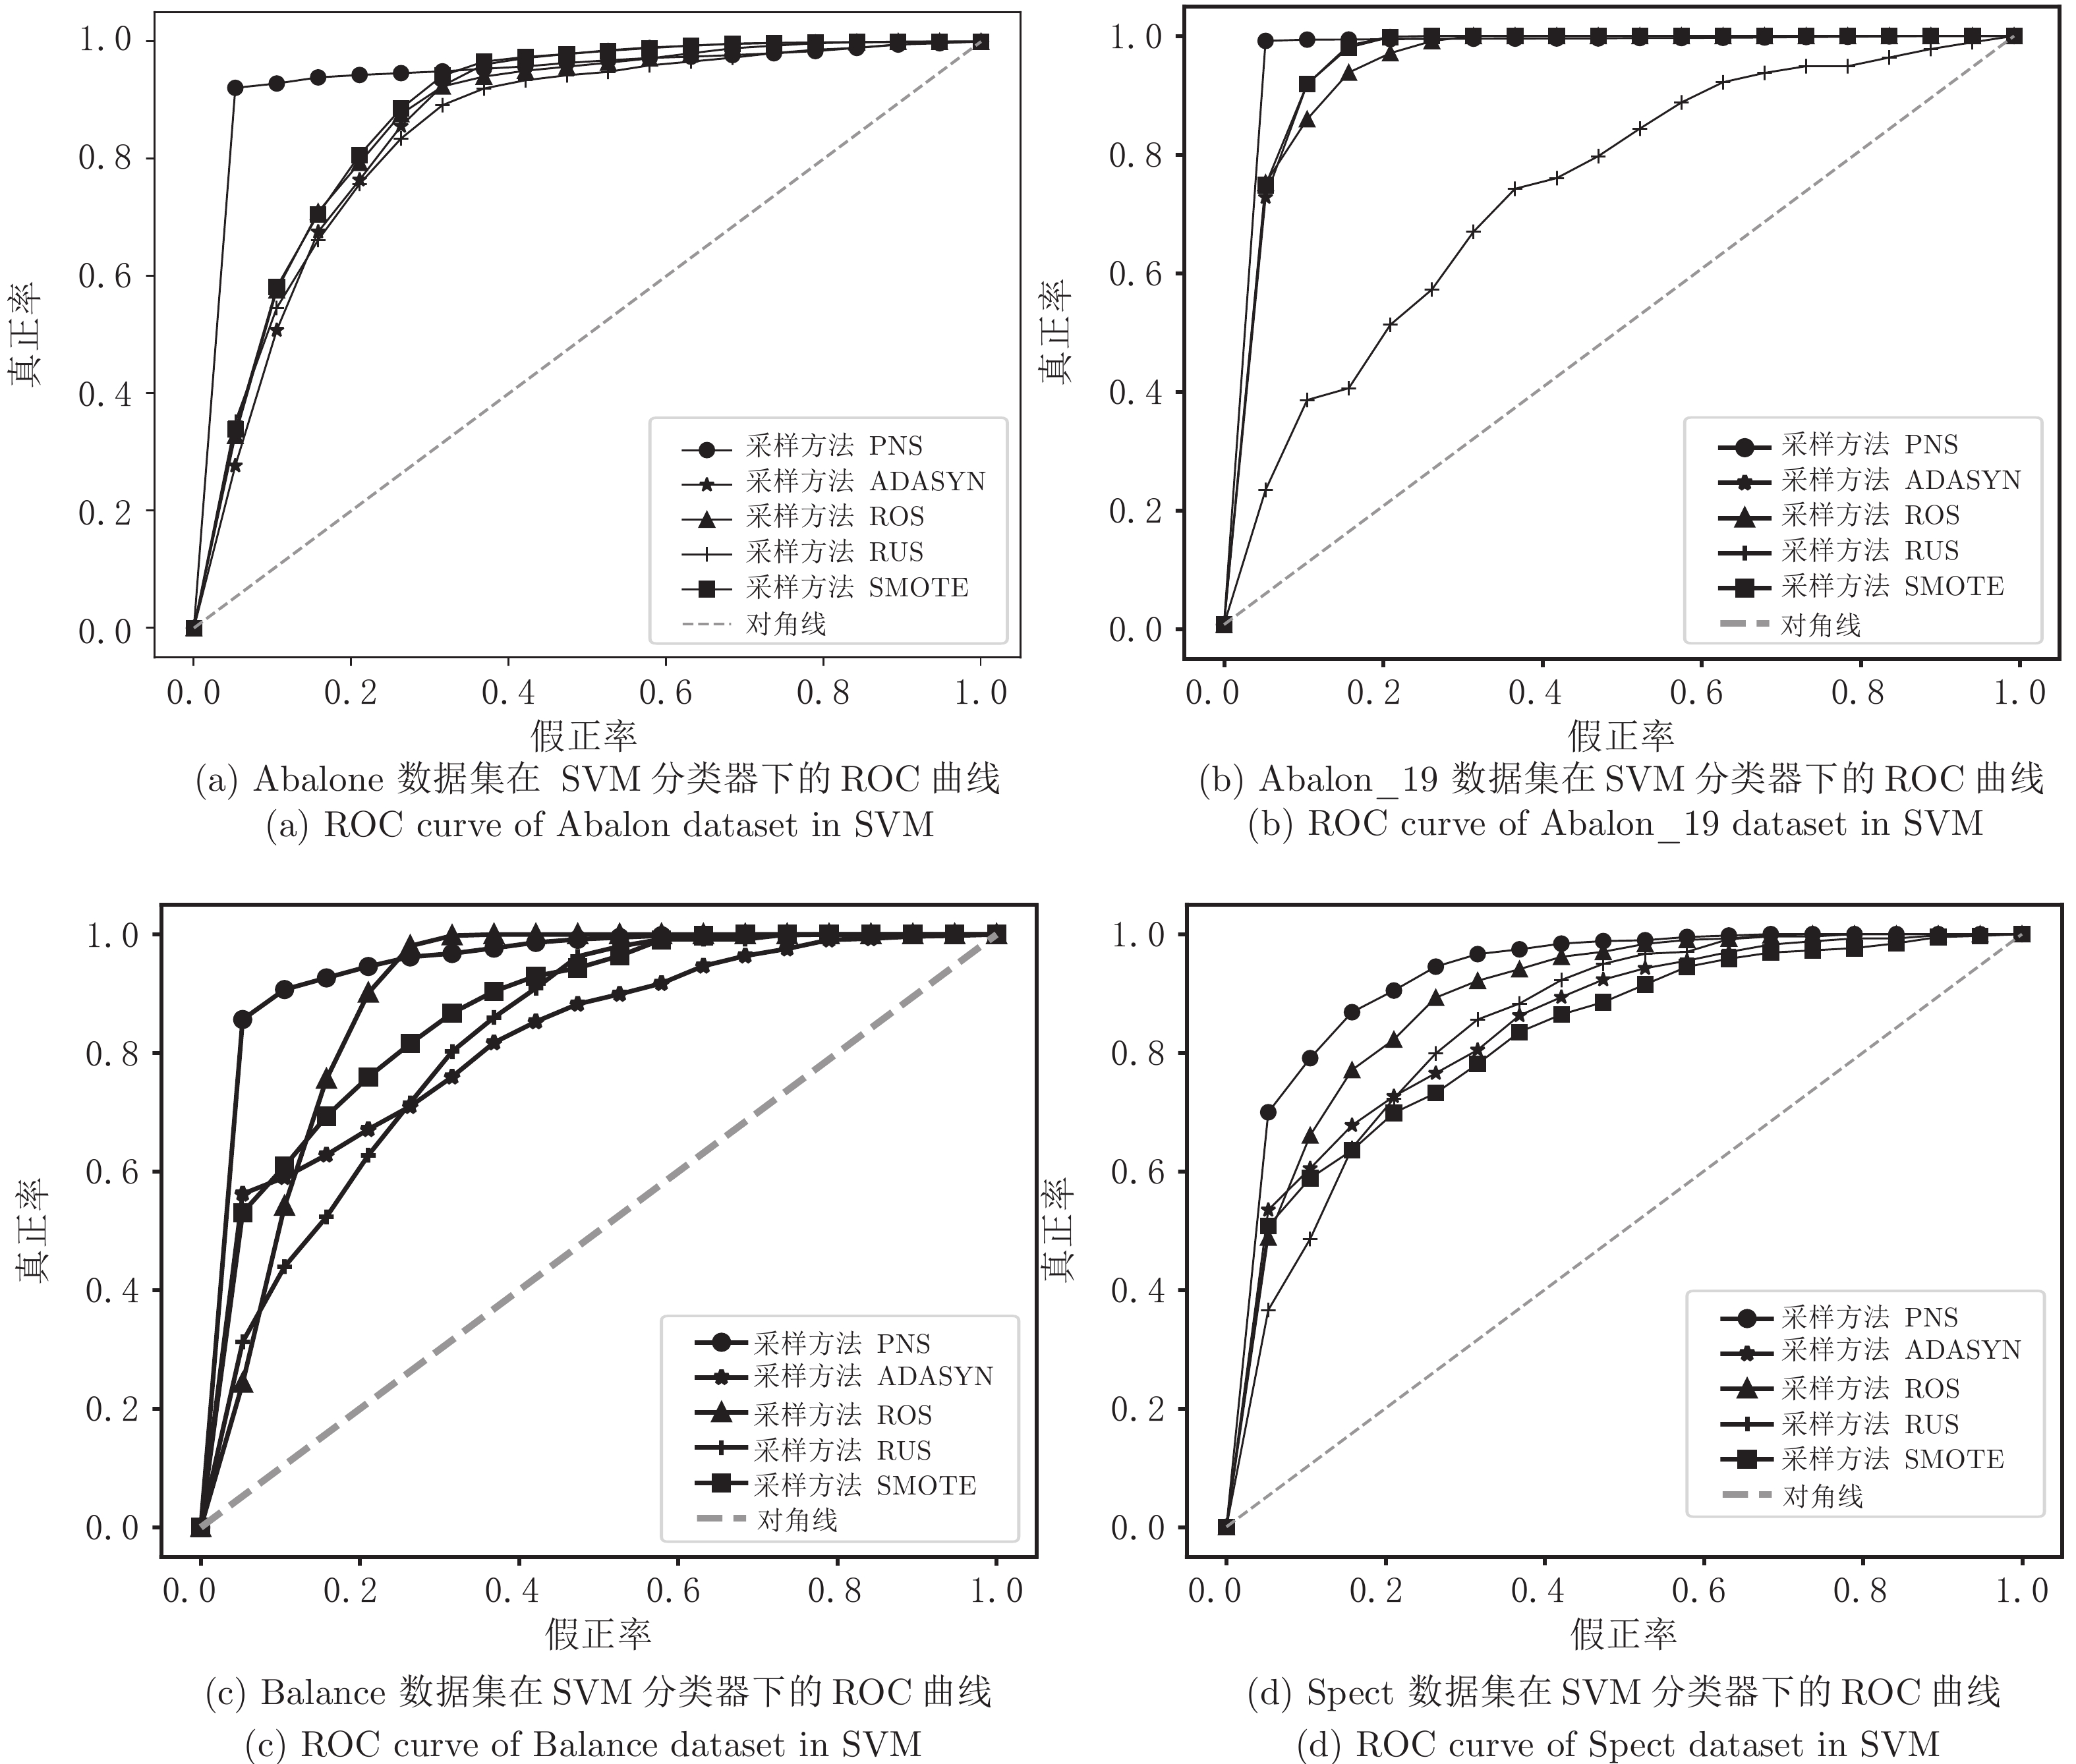
表 5 伪负样本采样与ROS, RUS, SMOTE, ADASYN采样方法对比结果
Table 5 Comparison of pseudo-negative sampling with the methods of ROS、RUS、SMOTE、ADASYN
数据集 评价指标 SVM LR PNS ROS RUS SMOTE ADASYN PNS ROS RUS SMOTE ADASYN SPECT Sen 0.767 0.746 0.594 0.381 0.438 0.732 0.685 0.605 0.643 0.604 Spe 0.907 0.856 0.860 0.985 0.970 0.862 0.846 0.828 0.838 0.843 Acc 0.862 0.817 0.760 0.794 0.789 0.816 0.793 0.748 0.768 0.751 MCC 0.682 0.590 0.461 0.509 0.531 0.586 0.527 0.432 0.507 0.485 F-score 0.774 0.715 0.585 0.535 0.575 0.707 0.667 0.594 0.622 0.611 AUC 0.941 0.912 0.861 0.857 0.867 0.909 0.889 0.848 0.849 0.824 SNP Sen 0.677 0.842 0.489 0.879 0.879 0.692 0.614 0.605 0.653 0.637 Spe 0.980 0.908 0.869 0.904 0.897 0.961 0.847 0.801 0.852 0.852 Acc 0.850 0.880 0.705 0.893 0.889 0.845 0.747 0.713 0.766 0.760 MCC 0.709 0.754 0.394 0.782 0.775 0.693 0.479 0.416 0.520 0.505 F-score 0.795 0.857 0.585 0.876 0.871 0.793 0.676 0.643 0.706 0.693 AUC 0.966 0.935 0.761 0.949 0.947 0.902 0.809 0.765 0.839 0.832 Ecoli Sen 0.826 0.715 0.644 0.720 0.661 0.746 0.644 0.616 0.610 0.573 Spe 0.975 0.962 0.964 0.963 0.956 0.975 0.958 0.954 0.962 0.956 Acc 0.952 0.925 0.916 0.925 0.908 0.941 0.908 0.902 0.908 0.900 MCC 0.806 0.693 0.633 0.692 0.623 0.755 0.618 0.598 0.612 0.570 F-score 0.828 0.728 0.665 0.727 0.664 0.781 0.655 0.634 0.647 0.616 AUC 0.982 0.958 0.949 0.957 0.951 0.962 0.936 0.923 0.935 0.930 SatImage Sen 0.924 0.892 0.847 0.915 0.933 0.823 0.580 0.540 0.595 0.553 Spe 0.917 0.904 0.898 0.907 0.871 0.827 0.763 0.747 0.766 0.757 Acc 0.919 0.899 0.879 0.910 0.893 0.825 0.697 0.671 0.704 0.683 MCC 0.830 0.786 0.741 0.810 0.784 0.636 0.344 0.288 0.361 0.312 F-score 0.892 0.865 0.835 0.880 0.864 0.772 0.580 0.539 0.591 0.557 AUC 0.980 0.960 0.946 0.966 0.953 0.913 0.778 0.756 0.786 0.768 Abalone Sen 0.906 0.721 0.651 0.740 0.703 0.903 0.726 0.710 0.735 0.697 Spe 0.994 0.835 0.839 0.830 0.822 0.978 0.805 0.802 0.804 0.804 Acc 0.965 0.797 0.776 0.800 0.783 0.954 0.779 0.769 0.781 0.769 MCC 0.922 0.549 0.493 0.559 0.515 0.895 0.518 0.499 0.525 0.489 F-score 0.945 0.701 0.655 0.709 0.676 0.928 0.684 0.669 0.689 0.660 AUC 0.966 0.868 0.840 0.876 0.861 0.973 0.850 0.842 0.850 0.836 Balance Sen 0.810 0.937 0.619 0.517 0.510 0.638 0.605 0.597 0.693 0.518 Spe 0.967 0.775 0.776 0.943 0.940 0.872 0.812 0.778 0.851 0.962 Acc 0.911 0.827 0.705 0.798 0.791 0.789 0.740 0.704 0.795 0.811 MCC 0.804 0.674 0.385 0.558 0.554 0.525 0.418 0.364 0.549 0.584 F-score 0.860 0.783 0.564 0.624 0.627 0.670 0.608 0.565 0.694 0.646 AUC 0.967 0.902 0.834 0.884 0.826 0.868 0.831 0.833 0.902 0.872 SolarFlare Sen 0.917 0.821 0.528 0.882 0.883 0.934 0.599 0.602 0.866 0.860 Spe 0.976 0.888 0.866 0.979 0.973 0.962 0.853 0.824 0.988 0.985 Acc 0.954 0.862 0.734 0.943 0.940 0.951 0.758 0.734 0.942 0.939 MCC 0.901 0.707 0.418 0.878 0.871 0.896 0.470 0.433 0.878 0.870 F-score 0.936 0.815 0.583 0.919 0.915 0.934 0.647 0.620 0.917 0.912 AUC 0.984 0.912 0.802 0.969 0.968 0.973 0.837 0.790 0.970 0.968 Yeast_ME2 Sen 0.757 0.708 0.482 0.721 0.688 0.573 0.548 0.538 0.633 0.575 Spe 0.982 0.965 0.970 0.967 0.966 0.967 0.958 0.959 0.960 0.960 Acc 0.946 0.923 0.889 0.927 0.920 0.902 0.892 0.884 0.906 0.896 MCC 0.791 0.706 0.545 0.720 0.695 0.608 0.566 0.545 0.634 0.593 F-score 0.818 0.747 0.575 0.759 0.738 0.653 0.618 0.584 0.683 0.643 AUC 0.976 0.955 0.882 0.961 0.955 0.947 0.901 0.891 0.910 0.901 Abalone_19 Sen 0.969 0.885 0.315 0.947 0.948 0.971 0.636 0.538 0.725 0.725 Spe 0.989 0.872 0.830 0.877 0.875 0.984 0.863 0.829 0.865 0.867 Acc 0.982 0.877 0.613 0.902 0.902 0.979 0.780 0.698 0.814 0.815 MCC 0.962 0.743 0.138 0.803 0.802 0.956 0.516 0.380 0.595 0.598 F-score 0.975 0.839 0.299 0.876 0.875 0.971 0.677 0.539 0.739 0.740 AUC 0.996 0.947 0.715 0.956 0.956 0.997 0.877 0.815 0.891 0.893
下载: 导出CSV
表 6 高比例不平衡数据采样对比
Table 6 The comparison of high ratio imbalanced data
数据集 评价指标 SVM LR PNS ROS RUS SMOTE ADASYN PNS ROS RUS SMOTE ADASYN Yeast1289vs7 Sen 0.892 0.752 0.533 0.845 0.843 0.775 0.691 0.558 0.726 0.719 Spe 0.952 0.919 0.833 0.860 0.844 0.850 0.824 0.786 0.815 0.809 Acc 0.925 0.849 0.695 0.853 0.843 0.817 0.768 0.668 0.777 0.771 MCC 0.848 0.690 0.392 0.701 0.682 0.627 0.521 0.355 0.542 0.529 F-score 0.909 0.806 0.582 0.827 0.817 0.780 0.712 0.570 0.731 0.723 AUC 0.980 0.935 0.793 0.930 0.926 0.902 0.837 0.793 0.848 0.844 Yeast1458vs7 Sen 0.855 0.681 0.356 0.713 0.737 0.590 0.503 0.415 0.570 0.592 Spe 0.934 0.899 0.879 0.877 0.870 0.835 0.843 0.829 0.823 0.820 Acc 0.904 0.820 0.684 0.817 0.821 0.745 0.719 0.660 0.731 0.735 MCC 0.794 0.602 0.283 0.599 0.612 0.437 0.369 0.265 0.406 0.421 F-score 0.866 0.730 0.431 0.736 0.748 0.623 0.562 0.445 0.602 0.617 AUC 0.965 0.904 0.720 0.897 0.899 0.822 0.769 0.744 0.792 0.794 Yeast4 Sen 0.770 0.687 0.543 0.733 0.703 0.574 0.572 0.558 0.603 0.566 Spe 0.982 0.969 0.965 0.970 0.966 0.968 0.958 0.955 0.959 0.960 Acc 0.947 0.923 0.892 0.930 0.923 0.904 0.895 0.886 0.902 0.895 MCC 0.798 0.701 0.571 0.734 0.706 0.613 0.582 0.559 0.611 0.584 F-score 0.824 0.741 0.609 0.770 0.747 0.662 0.634 0.605 0.656 0.635 AUC 0.976 0.954 0.908 0.961 0.957 0.946 0.902 0.881 0.906 0.903 Yeast5 Sen 0.704 0.706 0.596 0.745 0.721 0.622 0.576 0.559 0.590 0.546 Spe 0.995 0.989 0.990 0.991 0.990 0.987 0.987 0.988 0.987 0.988 Acc 0.980 0.975 0.970 0.979 0.976 0.969 0.966 0.966 0.967 0.967 MCC 0.770 0.714 0.644 0.759 0.728 0.642 0.605 0.590 0.614 0.588 F-score 0.772 0.720 0.641 0.765 0.734 0.647 0.609 0.587 0.620 0.593 AUC 0.994 0.990 0.986 0.991 0.992 0.988 0.988 0.988 0.988 0.988
下载: 导出CSV
表 7 不同采样方法时间对比
Table 7 Runtime comparison of different sampling methods
数据集 算法 RUS PNS SMOTE ROS ADASYN SPECT SVM 0.39 0.53 0.67 0.66 0.71 LR 0.56 0.69 0.80 0.75 0.81 DT 0.26 0.31 0.35 0.32 0.34 RF 1.70 1.77 1.91 1.84 1.98 SNP SVM 1.30 27.92 80.22 92.04 80.74 LR 0.70 1.41 2.16 2.09 2.26 DT 0.55 1.29 2.51 1.55 2.61 RF 2.32 7.32 13.76 9.45 13.91 Ecoli SVM 0.31 0.31 0.36 0.34 0.39 LR 0.39 0.43 0.44 0.44 0.44 DT 0.23 0.23 0.23 0.23 0.24 RF 1.54 1.58 1.56 1.56 1.58 SatImage SVM 7.59 75.68 189.22 201.02 238.91 LR 3.00 6.60 5.94 5.05 6.64 DT 1.02 2.75 4.03 3.47 4.86 RF 4.43 13.48 18.02 16.36 19.92 Abalone SVM 3.08 14.78 62.42 64.35 65.56 LR 1.02 3.58 4.74 4.67 4.81 DT 0.52 0.74 1.31 1.03 1.37 RF 2.86 4.75 9.61 7.73 9.48 Balance SVM 0.28 0.73 1.32 1.58 1.29 LR 0.25 0.35 0.68 0.38 0.68 DT 0.22 0.24 0.27 0.24 0.27 RF 1.49 1.67 1.74 1.73 1.76 SolarFlare SVM 0.44 3.46 9.25 12.31 9.30 LR 0.40 2.00 3.17 2.96 3.17 DT 0.29 0.36 0.46 0.43 0.50 RF 1.61 2.14 2.59 2.57 2.66 Yeast_ME2 SVM 0.44 1.84 2.95 3.189 3.161 LR 0.44 0.74 0.86 0.871 0.933 DT 0.29 0.36 0.38 0.361 0.436 RF 1.65 2.24 2.45 2.269 2.452 Abalone_19 SVM 0.44 6.81 66.16 75.09 66.20 LR 0.46 3.54 7.06 4.71 4.86 DT 0.39 0.71 1.49 0.86 1.47 RF 1.65 4.45 10.48 5.64 10.18 总计 44.69 197.95 511.77 530.30 567.05
下载: 导出CSV
-
[1] Hou J, Shi X, Chen C, Solimanislam M, Johnson A F, et al. Global impacts of chromosomal imbalance on gene expression in arabidopsis and other taxa. Proceedings of the National Academy of Sciences, 2018, 115(48): E11321−E11330 doi: 10.1073/pnas.1807796115 [2] Zhang Y, Qiao S, Ji S, Han N, Liu D, et al. Identification of DNA-protein binding sites by bootstrap multiple convolutional neural networks on sequence information. Engineering Applications of Artificial Intelligence, 2019, 79: 58−66 doi: 10.1016/j.engappai.2019.01.003 [3] Zhao Z, Peng H, Lan C, Zheng Y, Fang L, et al. Imbalance learning for the prediction of N 6-methylation sites in mRNAs. BMC Genomics, 2018, 19(1): 574 doi: 10.1186/s12864-018-4928-y [4] Du X, Yao Y, Diao Y, Zhu H, Zhang Y, et al. Deepss: exploring splice site motif through convolutional neural network directly from dna sequence. IEEE Access, 2018, 6: 32958−32978 doi: 10.1109/ACCESS.2018.2848847 [5] Maji R K, Khatua S, Ghosh Z. A supervised ensemble approach for sensitive microRNA target prediction. IEEE/ACM Transactions on Computational Biology and Bioinformatics, 2020, 17(1): 37−46 doi: 10.1109/TCBB.2018.2858252 [6] Zhang X, Lin X, Zhao J, Huang Q, Xu X. Efficiently predicting hot spots in PPIs by combining random forest and synthetic minority over-sampling technique. IEEE/ACM Transactions on Computational Biology and Bioinformatics, 2018, 16(3): 774−781 [7] Luo K, Wang G, Li Q, Tao J. An improved SVM-RFE based on F-statistic and mPDC for gene selection in cancer classification. IEEE Access, 2019, 7: 147617−147628 doi: 10.1109/ACCESS.2019.2946653 [8] Fotouhi S, Asadi S, Kattan M W. A comprehensive data level analysis for cancer diagnosis on imbalanced data. Journal of Biomedical Informatics, 2019, 90: 103089 doi: 10.1016/j.jbi.2018.12.003 [9] Soh W W, Yusuf R M. Predicting credit card fraud on a imbalanced data. International Journal of Data Science and Advanced Analytics, 2019, 1(1): 12−17 [10] 张宏莉, 鲁刚. 分类不平衡协议流的机器学习算法评估与比较. 软件学报, 2012, 23(6): 1500−1516 doi: 10.3724/SP.J.1001.2012.04074Zhang Hong-Li, Lu Gang. Machine learning algorithms for classifying the imbalanced protocol flows: evaluation and comparison. Journal of Software, 2012, 23(6): 1500−1516 doi: 10.3724/SP.J.1001.2012.04074 [11] He H, Garcia E A. Learning from imbalanced data. IEEE Transactions on Knowledge and Data Engineering, 2009, 21(9): 1263−1284 doi: 10.1109/TKDE.2008.239 [12] 林舒杨, 李翠华, 江弋, 林琛, 邹权. 不平衡数据的降采样方法研究. 计算机研究与发展, 2011, 48(S3): 47−53Lin Shu-Yang, Li Cui-Hua, Jiang Yi, Lin Chen, Zou Quan. Under-sampling method research in class-imbalanced data. Journal of Computer Research Development, 2011, 48(S3): 47−53 [13] Zhang Y, Qiao S, Lu R, Han N, Liu D, et al. How to balance the bioinformatics data: pseudo-negative sampling. BMC Bioinformatics, 2019, 20(25): 1−13 [14] Liu D, Qiao S, Han N, Wu T, Mao R, et al. SOTB: semi-supervised oversampling approach based on trigonal barycenter theory. IEEE Access, 2020, 8: 50180−50189 doi: 10.1109/ACCESS.2020.2980157 [15] 蒋盛益, 谢照青, 余雯. 基于代价敏感的朴素贝叶斯不平衡数据分类研究. 计算机研究与发展, 2011, 48(S1): 387−390Jiang Sheng-Yi, Xie Zhao-Qing, Yu Wen. Naive bayes classification algorithm based on cost sensitive for imbalanced data distribution. Journal of Computer Research Development, 2011, 48(S1): 387−390 [16] Yu L, Zhou R, Tang L, Chen R. A DBN-based resampling SVM ensemble learning paradigm for credit classification with imbalanced data. Applied Soft Computing, 2018, 69: 192−202 doi: 10.1016/j.asoc.2018.04.049 [17] Castellanos F J, Valero-Mas J J, Calvo-Zaragoza J, Rico-Juan J R. Oversampling imbalanced data in the string space. Pattern Recognition Letters, 2018, 103: 32−38 doi: 10.1016/j.patrec.2018.01.003 [18] Sun B, Chen H, Wang J, Xie H. Evolutionary under-sampling based bagging ensemble method for imbalanced data classification. Frontiers of Computer Science, 2018, 12(2): 331−350 doi: 10.1007/s11704-016-5306-z [19] Chawla N V, Bowyer K W, Hall L O, Kegelmeyer W P. SMOTE: synthetic minority over-sampling technique. Journal of Artificial Intelligence Research, 2002, 16: 321−357 doi: 10.1613/jair.953 [20] Douzas G, Bacao F. Effective data generation for imbalanced learning using conditional generative adversarial networks. Expert Systems with Applications, 2018, 91: 464−471 doi: 10.1016/j.eswa.2017.09.030 [21] Wilson D L. Asymptotic properties of nearest neighbor rules using edited data. IEEE Transactions on Systems, Man, and Cybernetics, 1972, SMC-2(3): 408−421 doi: 10.1109/TSMC.1972.4309137 [22] Laurikkala J. Improving identification of difficult small classes by balancing class distribution. In: Proceedings of the 2001 Conference on Artificial Intelligence in Medicine in Europe. Berlin, Ger-many: 2001. 63−66 [23] Zhang Z L, Luo X G, García S, Herrera F. Cost-sensitive back-propagation neural networks with binarization techniques in addressing multi-class problems and non-competent classifiers. Applied Soft Computing, 2017, 56: 357−367 doi: 10.1016/j.asoc.2017.03.016 [24] Liu N, Shen J, Xu M, Gan D, Qi E, et al. Improved cost-sensitive support vector machine classifier for breast cancer diagnosis. Mathematical Problems in Engineering, 2018, 4: 1−13 [25] Breiman L. Bagging predictors. Machine Learning, 1996, 24(2): 123−140 [26] Schapire R E. The strength of weak learnability. Machine Learning, 1990, 5(2): 197−227 [27] Friedman J, Hastie T, Tibshirani R. Additive logistic regression: a statistical view of boosting (with discussion and a rejoinder by the authors). the Annals of Statistics, 2000, 28(2): 337−407 [28] Elmore K L, Richman M B. Euclidean distance as a similarity metric for principal component analysis. Monthly Weather Review, 2001, 129(3): 540−549 doi: 10.1175/1520-0493(2001)129<0540:EDAASM>2.0.CO;2 [29] Park M W, Lee E C. Similarity measurement method between two songs by using the conditional Euclidean distance. Wseas Transaction on Information Science and Applications, 2013, 10(12), 381−388 [30] He H, Bai Y, Garcia E A, Li S. ADASYN: Adaptive synthetic sampling approach for imbalanced learning. In: Proceedings of the 2008 International Joint Conference on Neural Networks (World Congress on Computational Intelligence). Hong Kong, China: IEEE, 2008. 1322−1328 [31] Fernández A, del Río S, Chawla N V, Herrera F. An insight into imbalanced big data classification: Outcomes and challenges. Complex & Intelligent Systems, 2017, 3(2): 105−120 [32] Alcalá-Fdez J, Sanchez L, Garcia S, Deljesus M J, Ventura S, et al. KEEL: a software tool to assess evolutionary algorithms for data mining problems. Soft Computing, 2009, 13(3): 307−318 doi: 10.1007/s00500-008-0323-y [33] 罗珍珍, 陈靓影, 刘乐元, 张坤. 基于条件随机森林的非约束环境自然笑脸检测. 自动化学报, 2018, 44(4): 696−706Luo Zhen-Zhen, Chen Jing-Ying, Liu Le-Yuan, Zhang Kun. Conditional random forests for spontaneous smile detection in unconstrained environment. Acta Automatica Sinica, 2018, 44(4): 696−706 [34] Breiman L. Random forests. Machine Learning, 2001, 45(1): 5−32 doi: 10.1023/A:1010933404324 [35] 张学工. 关于统计学习理论与支持向量机. 自动化学报, 2000, 26(1): 32−42Zhang Xue-gong. Introduction to statistical learning theory and support vector machines. Acta Automatica Sinica, 2000, 26(1): 32−42 [36] Cortes C, Vapnik V. Support-vector networks. Machine Learning, 1995, 20(3): 273−297 [37] Cox D R. The regression analysis of binary sequences. Journal of the Royal Statistical Society: Series B (Methodological), 1958, 20(2): 215−232 doi: 10.1111/j.2517-6161.1958.tb00292.x [38] 毛毅, 陈稳霖, 郭宝龙, 陈一昕. 基于密度估计的逻辑回归模型. 自动化学报, 2014, 40(1): 62−72Mao Yi, Chen Wen-Lin, Guo Bao-Long, Chen Yi-Xin. A novel logistic regression model based on density estimation. Acta Automatica Sinica, 2014, 40(1): 62−72 [39] Quinlan J R. Induction of decision trees. Machine Learning, 1986, 1(1): 81−106 [40] 王雪松, 潘杰, 程玉虎, 曹戈. 基于相似度衡量的决策树自适应迁移. 自动化学报, 2013, 39(12): 2186−2192Wang Xue-Son, Pan Jie, Cheng Yu-Hu, Cao Ge. Self-adaptive transfer for decision trees based on similarity metric. Acta Automatica Sinica, 2013, 39(12): 2186−2192 [41] 乔少杰, 金琨, 韩楠, 唐常杰, 格桑多吉, Gutierrez L A. 一种基于高斯混合模型的轨迹预测算法. 软件学报, 2015, 26(5): 1048−1063Qiao S, Jin K, Han N, Tang C, Ge S, Gutierrez L A. Trajectory prediction algorithm based on Gaussian mixture model. Journal of Software, 2015, 26(5): 1048−1063 [42] 乔少杰, 韩楠, 丁治明, 金澈清, 孙未未, 舒红平. 多模式移动对象不确定性轨迹预测模型. 自动化学报, 2018, 44(4): 608−618Qiao S, Han N, Ding Z, Jin C, Sun W, Shu H. A multiple-motion-pattern trajectory prediction model for uncertain moving objects. Acta Automatica Sinica, 2018, 44(4): 608−618 [43] 乔少杰, 郭俊, 韩楠, 张小松, 元昌安, 唐常杰. 大规模复杂网络社区并行发现算法. 计算机学报, 2017, 40(3): 687−700 doi: 10.11897/SP.J.1016.2017.00687Qiao S, Guo J, Han N, Zhang X, Yuan C, Tang C. Parallel algorithm for discovering communities in large-scale complex networks. Chinese Journal of Computers, 2017, 40(3): 687−700 doi: 10.11897/SP.J.1016.2017.00687 -

 下载:
下载:


计量
- 文章访问数: 1063
- HTML全文浏览量: 1033
- PDF下载量: 306
- 被引次数: 0
