

Cascade Sparse Convolution and Decision Tree Ensemble Model for Nuclear Segmentation in Pathology Images
-
摘要: 数字病理图像分析对于乳腺癌、肾癌等良恶性分级诊断具有重要意义, 其中细胞核的形态测量是病理量化分析的关键. 然而, 由于病理图像背景复杂, 细胞核高密度分布、细胞粘连等, 个体细胞核精准分割是一个挑战性问题. 本文提出一个级联稀疏卷积与决策树集成学习的细胞核分割模型. 该模型由稀疏可分离卷积模块和集成决策树学习的正则化回归模块堆叠级联组成, 其中: 前者采取秩-1张量分解学习机制, 可分层抽取细胞核的多尺度方向分布式抽象特征; 而后者采取随机采样、树剪枝以及正则化回归机制提升逐像素回归分类能力. 相比于现有深度学习模型, 该模型无需非线性激活和后向传播计算, 参数规模较小, 可实现端到端的学习. 通过乳腺、前列腺、肾脏、胃和膀胱等多组病理图像的分割实验表明: 该模型能够实现复杂数字病理图像中的高密度细胞核的快速个体目标检测和分割, 在Jaccard相似性系数、F1分数和平均边缘距离三个指标上均优于目前CNN2、CNN3和U-Net等深度学习方法, 具有较好应用前景.Abstract: The quantitative analysis of digital pathology images plays a significant role in the diagnosis of benign and malignant diseases such as breast and prostate cancer, in which nuclear morphology measurement serve as a basis of quantitative analyses. However, due to the complex background of pathology images, dense distributions of nuclei, and nucleus adhesions, accurate segmentation of individual nuclei remains a challenging problem. In this paper, we propose a new method to automatically segment nuclei from digital pathology images with cascade sparse convolution and decision tree ensemble (CscDTE) model. In particular, the sparse separable convolution learning module and the decision tree ensemble learning module are stacked in a cascaded manner to form the CscDTE model. The former adopts rank-one tensor decomposition learning mechanism that can extract multiscale and multi-directional distributed abstract features; while the latter employs random sampling, pruning, and regularized regression mechanism to boost per-pixel regression and/or classification performance. Compared with the popular deep neural networks, the proposed CscDTE model does not require nonlinear activation and backpropagation computation, and depends on fewer parameters. Our CscDTE model is trained in a layer-wise manner that can achieve an end-to-end pixelwise learning and fast nuclear detection and segmentation in high-throughput imagery. We demonstrated the superiority of our method in terms of Jaccard index, F1 score, and average boundary distance by evaluating it on the multi-disease state and multi-organ dataset where consistently higher performance was obtained as compared to convolutional neural networks and fully convolutional networks.
-
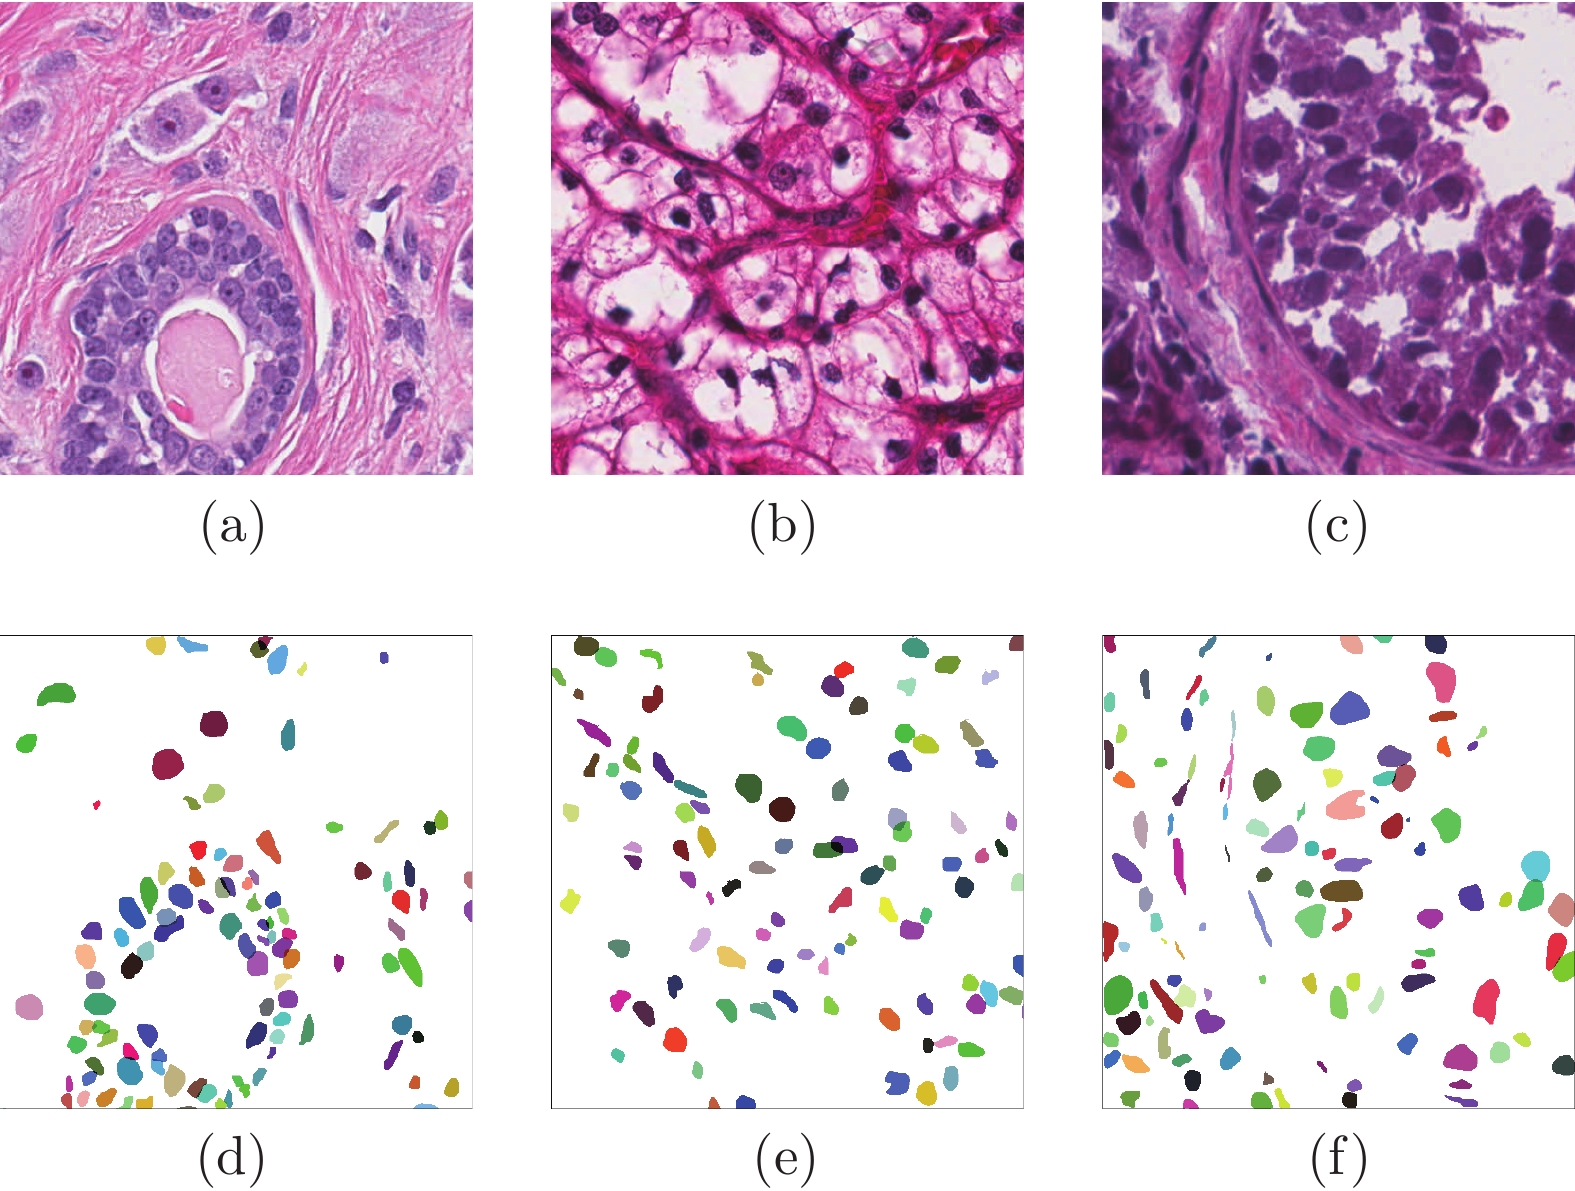
图 1 病理细胞核图像分割的挑战与人工分割结果
Fig. 1 Challenges in nuclear segmentation and associated ground truth
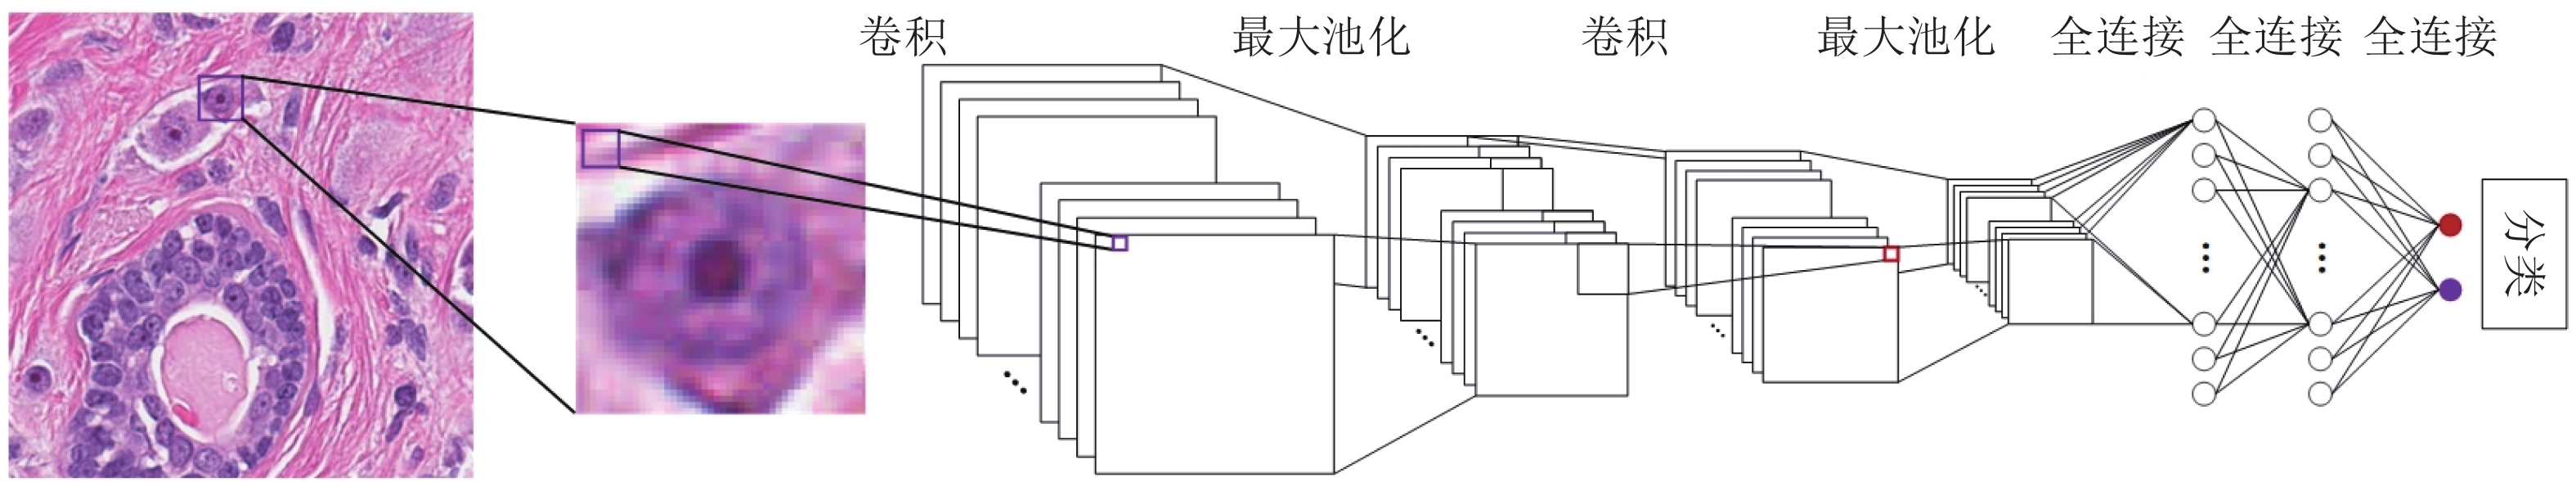
图 2 用于病理图像分割的CNN体系结构
Fig. 2 The CNN-style architecture for pathology image segmentation
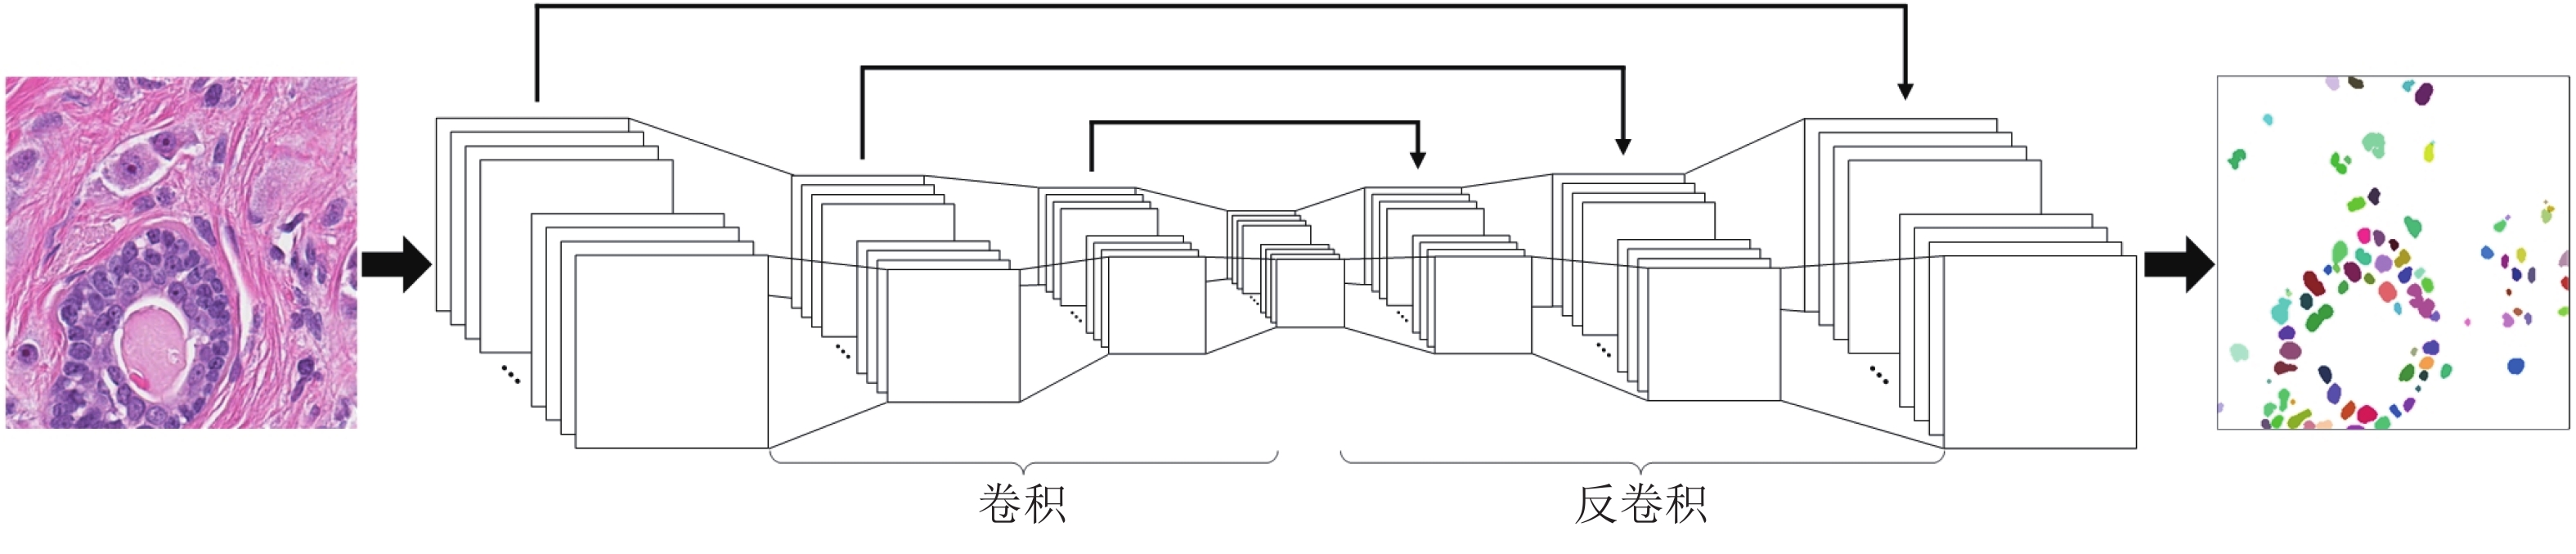
图 3 用于病理图像分割的U-Net体系结构
Fig. 3 The U-Net-style architecture for pathology image segmentation
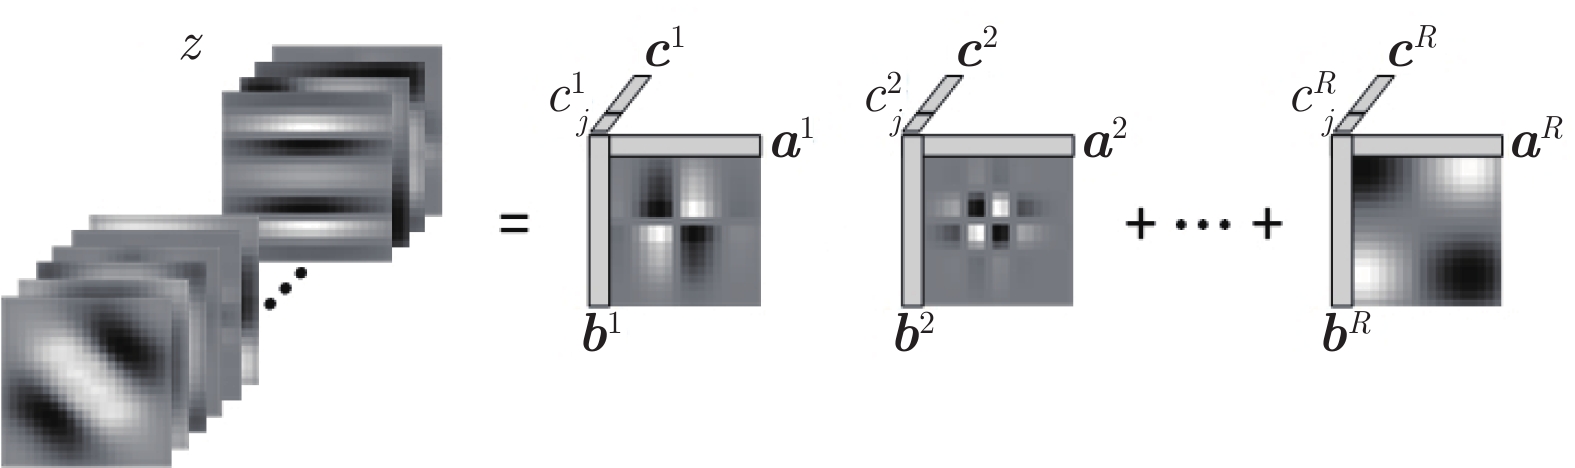
图 5 基于张量分解技术学习一组秩-1可分离核
Fig. 5 Tensor decomposition for learning rank-1 separable kernels
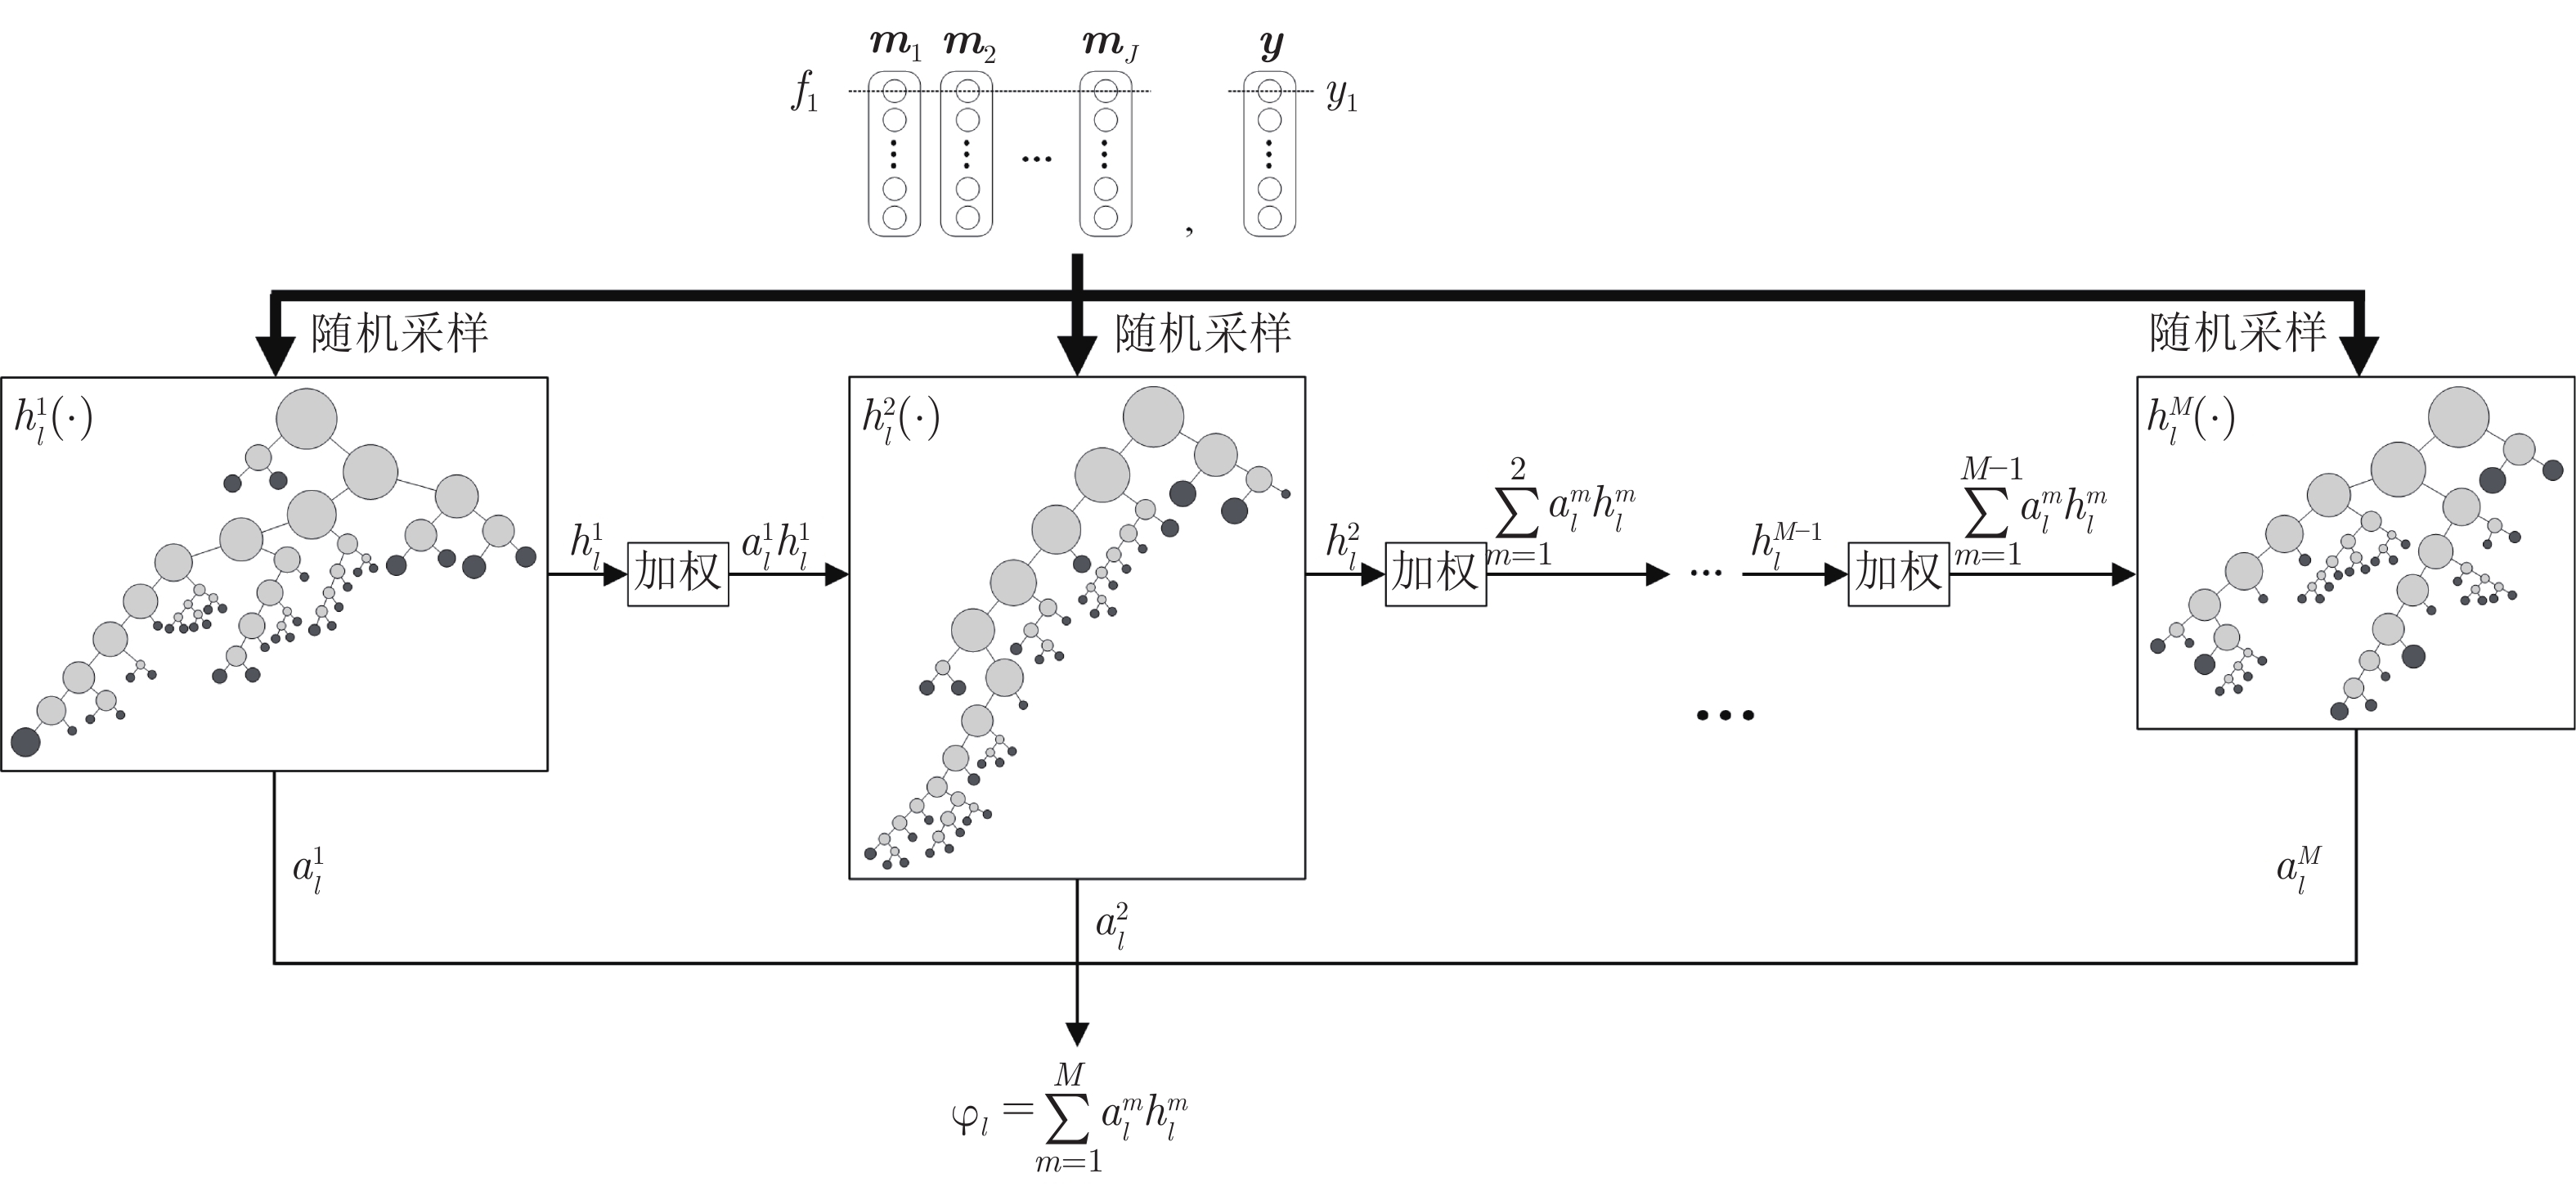
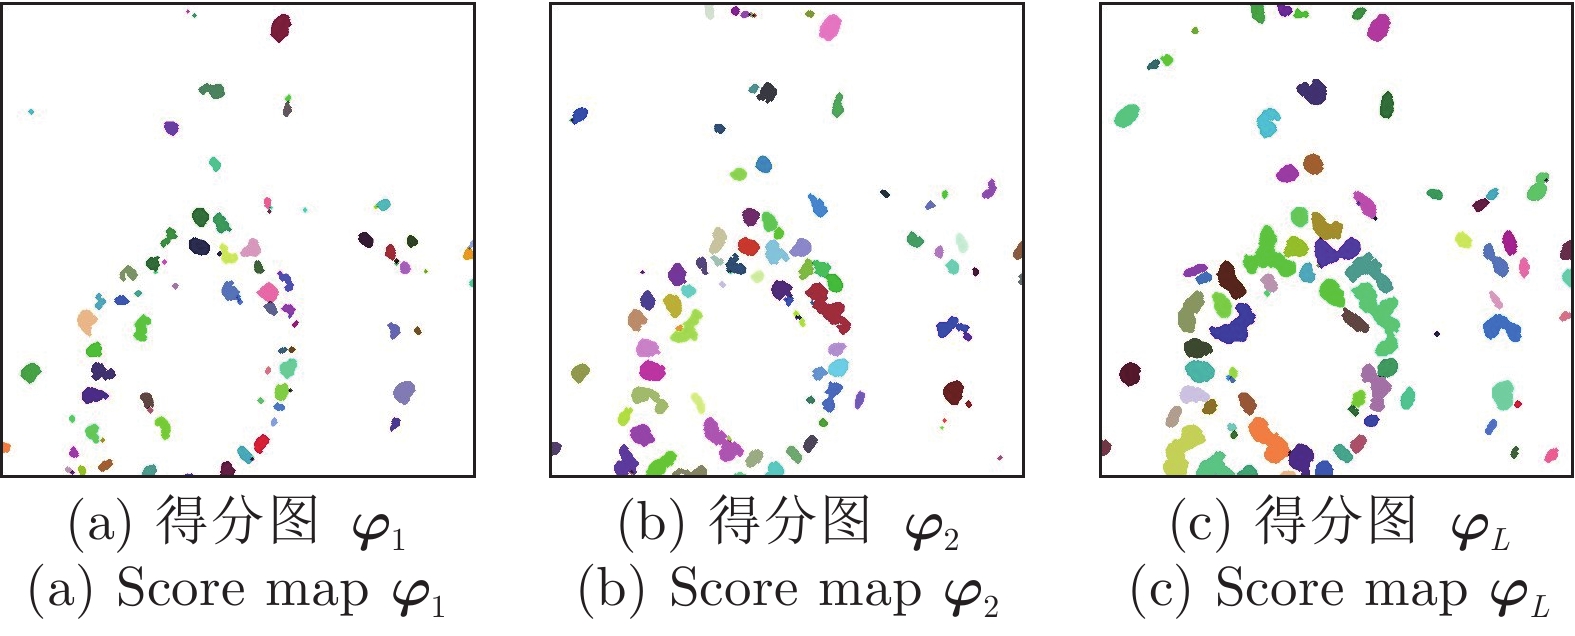
图 6 CscDTE框架中的集成决策树学习模块的训练过程
Fig. 6 Flowchart of the training procedure for the decision tree ensemble learning module of CscDTE framework

图 8 Kumar病理细胞核相同器官图像的分割比较
Fig. 8 Comparative segmentation results on the Kumar same-organs testing pathology images

图 9 Kumar病理细胞核不同器官图像的分割比较
Fig. 9 Comparative segmentation results on the Kumar different-organs testing pathology images
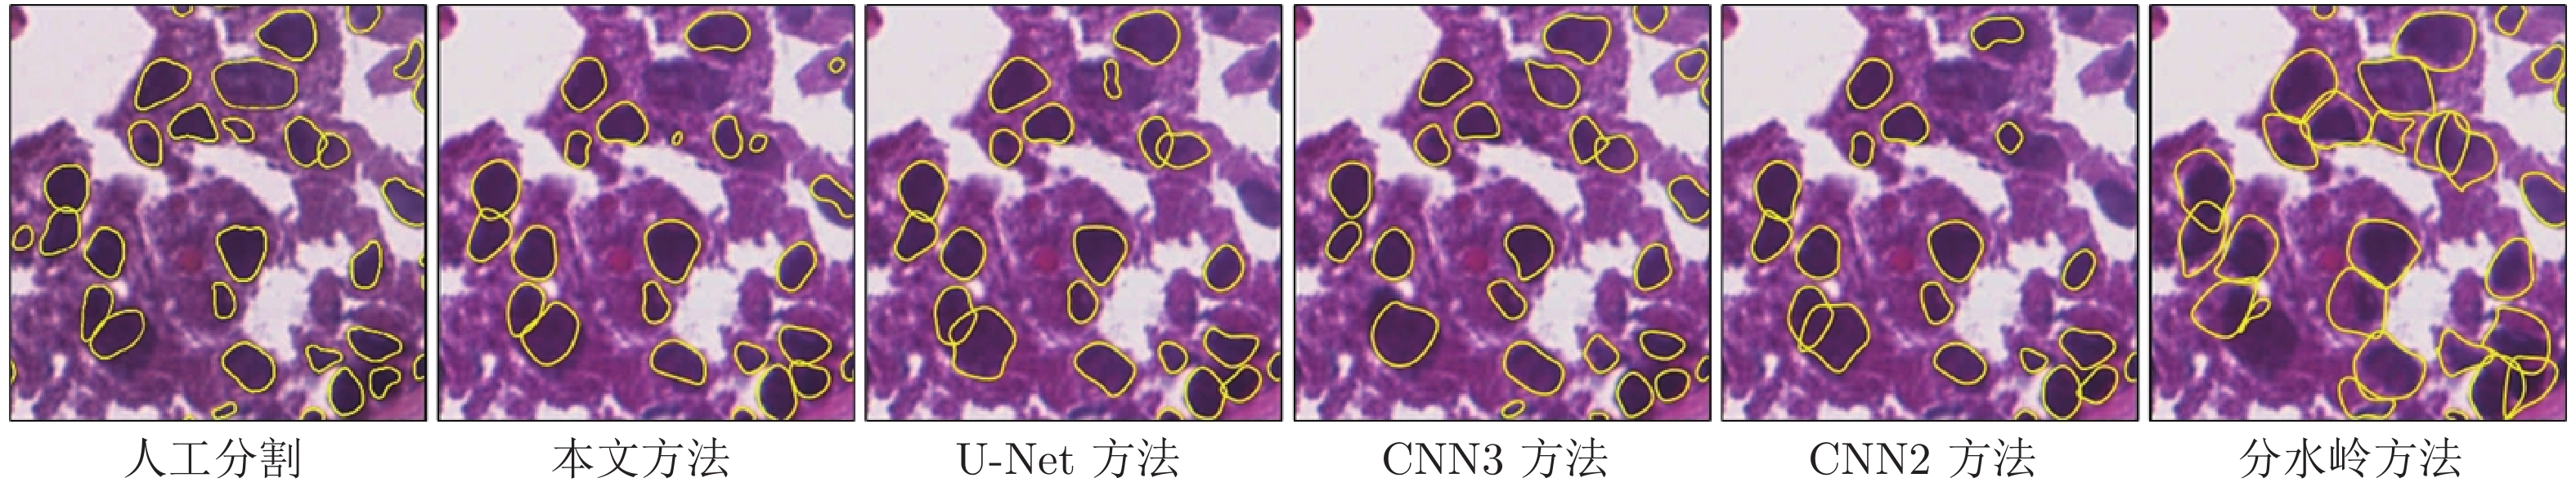
图 10 不同算法在具有重叠、形状及大小不规则的病理图像上的轮廓可视化分割结果图
Fig. 10 Visualizing segmented contours of different algorithms on the pathology image with shape and color variations and overlapping regions

图 11 本文方法与U-Net方法在KIRC数据集上的分割比较
Fig. 11 Comparative segmentation using ours and U-Net on the KIRC dataset
表 1 提出的CscDTE模型的最优参数值. 像素位置样本总数为800 000
Table 1 The optimal hyper-parameter values of our CscDTE model. The total number of pixel samples is 800 000
数据集 $N$ $L$ ${d^2(R)}$( ${1^{\rm{st}}}$layer; ${2^{\rm{nd}}\sim L^{\rm{th}}}$layers) $M$ TCGA WSIs 200 000 5 $11^2$(25), $17^2$(8), $21^2$(72), $29^2$(8), $43^2$(44); $11^2$(25), $21^2$(36), $43^2$(36) 50  下载: 导出CSV
表 2 用于病理图像分割的CNN2体系结构
Table 2 The CNN2 architecture for pathology image segmentation
网络层 滤波器尺寸 激活 输出尺寸 随机丢弃率 输入 – – $ {\rm{55}} \times {\rm{55}} \times {\rm{3}} $ – 卷积 1 $ {\rm{6}} \times {\rm{6}} $ ReLU $ {\rm{50}} \times {\rm{50}} \times {\rm{48}} $ 0.1 池化 1 $ {\rm{2}} \times {\rm{2}} $ Max $ {\rm{25}} \times {\rm{25}} \times {\rm{48}} $ – 卷积 2 $ {\rm{4}} \times {\rm{4}} $ ReLU $ {\rm{22}} \times {\rm{22}} \times {\rm{48}} $ 0.2 池化 2 $ {\rm{2}} \times {\rm{2}} $ Max $ {\rm{11}} \times {\rm{11}} \times {\rm{48}} $ – 全连接 1 – ReLU $ {\rm{1\,024}} \times {\rm{1}} $ 0.5 全连接 2 – ReLU ${\rm{1\,024} } \times {\rm{1} }$ 0.5 输出 – SoftMax $ 2 \times 1 $ –
下载: 导出CSV
表 3 用于病理图像分割的CNN3体系结构
Table 3 The CNN3 architecture for pathology image segmentation
网络层 滤波器尺寸 激活 输出尺寸 随机丢弃率 输入 – – $ {\rm{51}} \times {\rm{51}} \times {\rm{3}} $ – 卷积 1 $ {\rm{4}} \times {\rm{4}} $ ReLU $ {\rm{48}} \times {\rm{48}} \times {\rm{25}} $ 0.1 池化 1 $ {\rm{2}} \times {\rm{2}} $ Max $ {\rm{24}} \times {\rm{24}} \times {\rm{25}} $ – 卷积 2 $ {\rm{5}} \times {\rm{5}} $ ReLU $ {\rm{20}} \times {\rm{20}} \times {\rm{50}} $ 0.2 池化 2 $ {\rm{2}} \times {\rm{2}} $ Max $ {\rm{10}} \times {\rm{10}} \times {\rm{50}} $ – 卷积 3 $ {\rm{6}} \times {\rm{6}} $ ReLU $ {\rm{5}} \times {\rm{5}} \times {\rm{80}} $ 0.25 池化 3 $ {\rm{2}} \times {\rm{2}} $ Max $ {\rm{3}} \times {\rm{3}} \times {\rm{80}} $ – 全连接 1 – ReLU ${\rm{1\,024} } \times {\rm{1} }$ 0.5 全连接 2 – ReLU ${\rm{1\,024} } \times {\rm{1} }$ 0.5 输出 – SoftMax $ 3 \times 1 $ –
下载: 导出CSV
表 4 本文方法与其他方法在Kumar病理数据集上的分割性能(均值)比较
Table 4 Performance comparison of other methods with our CscDTE (For each metric, the mean are listed)
器官 图像 Jaccard相似性系数 精确率 F1分数 平均边缘距离 本文 U-Net CNN3 CNN2 分水岭 本文 U-Net CNN3 CNN2 分水岭 本文 U-Net CNN3 CNN2 分水岭 本文 U-Net CNN3 CNN2 分水岭 乳腺 1 0.594 0.539 0.570 0.569 0.545 0.810 0.832 0.756 0.764 0.591 0.745 0.700 0.726 0.725 0.706 14.90 42.78 29.68 64.46 42.36 2 0.675 0.613 0.603 0.448 0.592 0.832 0.803 0.844 0.853 0.625 0.806 0.760 0.752 0.619 0.744 12.99 13.12 14.34 62.27 18.49 前列腺 1 0.646 0.634 0.656 0.625 0.585 0.867 0.858 0.858 0.871 0.679 0.785 0.776 0.792 0.769 0.739 12.56 15.87 11.41 10.22 24.40 2 0.342 0.485 0.459 0.387 0.409 0.834 0.827 0.906 0.832 0.603 0.510 0.653 0.629 0.558 0.581 88.69 34.51 40.34 56.01 37.81 肾脏 1 0.692 0.673 0.641 0.691 0.570 0.752 0.782 0.848 0.755 0.606 0.818 0.804 0.781 0.817 0.726 12.14 15.25 19.47 12.24 30.03 2 0.513 0.539 0.524 0.463 0.512 0.765 0.789 0.763 0.681 0.570 0.678 0.701 0.687 0.633 0.677 16.35 21.48 12.73 21.38 9.48 膀胱 1 0.603 0.551 0.581 0.550 0.325 0.846 0.756 0.720 0.795 0.330 0.752 0.711 0.735 0.709 0.490 41.97 86.13 22.91 52.33 79.61 2 0.759 0.629 0.580 0.656 0.508 0.867 0.898 0.926 0.909 0.516 0.863 0.772 0.734 0.792 0.674 6.58 14.32 17.09 19.03 22.04 胃 1 0.781 0.645 0.622 0.577 0.647 0.881 0.920 0.824 0.913 0.692 0.877 0.784 0.767 0.732 0.785 1.99 7.44 8.49 9.16 3.67 2 0.785 0.641 0.714 0.623 0.679 0.891 0.931 0.948 0.910 0.736 0.880 0.781 0.833 0.767 0.809 1.09 6.82 5.41 6.75 1.76 相同器官 0.577 0.581 0.576 0.531 0.536 0.810 0.815 0.829 0.793 0.612 0.724 0.732 0.728 0.687 0.696 26.27 23.84 21.33 37.76 27.10 不同器官 0.732 0.617 0.624 0.602 0.540 0.871 0.876 0.855 0.882 0.569 0.843 0.762 0.767 0.750 0.690 12.91 28.68 13.48 21.82 26.77 整体 0.639 0.595 0.595 0.559 0.537 0.835 0.840 0.839 0.828 0.595 0.771 0.744 0.744 0.712 0.693 20.93 25.77 18.19 31.39 26.97
下载: 导出CSV
表 5 本文方法与其他方法在Kumar病理数据集上的分割性能(标准差)比较
Table 5 Performance comparison of other methods with our CscDTE (For each metric, the standard deviation are listed)
器官 Jaccard相似性系数 精确率 F1分数 平均边缘距离 本文 U-Net CNN3 CNN2 分水岭 本文 U-Net CNN3 CNN2 分水岭 本文 U-Net CNN3 CNN2 分水岭 本文 U-Net CNN3 CNN2 分水岭 乳腺 0.057 0.052 0.023 0.086 0.033 0.016 0.021 0.062 0.063 0.024 0.043 0.042 0.018 0.075 0.027 1.35 20.97 10.85 1.55 16.88 前列腺 0.215 0.105 0.139 0.168 0.125 0.023 0.022 0.034 0.028 0.054 0.195 0.087 0.115 0.149 0.112 53.83 13.18 20.46 32.38 9.48 肾脏 0.127 0.095 0.083 0.161 0.041 0.009 0.005 0.060 0.052 0.026 0.099 0.073 0.067 0.130 0.035 2.98 4.41 4.77 6.46 14.53 膀胱 0.110 0.055 0.001 0.075 0.129 0.015 0.100 0.146 0.081 0.132 0.079 0.043 0.001 0.059 0.130 25.02 50.78 4.12 23.55 40.71 胃 0.003 0.003 0.065 0.033 0.023 0.007 0.008 0.088 0.002 0.031 0.002 0.002 0.047 0.025 0.017 0.64 0.44 2.18 1.70 1.35 相同器官 0.132 0.071 0.075 0.117 0.069 0.044 0.029 0.058 0.072 0.037 0.116 0.057 0.062 0.099 0.061 30.62 12.09 11.45 25.79 12.23 不同器官 0.087 0.044 0.063 0.047 0.161 0.020 0.081 0.105 0.058 0.185 0.061 0.034 0.046 0.037 0.145 19.52 38.45 8.00 21.02 36.39 整体 0.136 0.062 0.071 0.098 0.106 0.047 0.061 0.076 0.078 0.113 0.112 0.049 0.057 0.084 0.096 26.37 24.09 10.52 24.18 22.91
下载: 导出CSV
表 6 本文方法与U-Net在KIRC数据集上的分割性能(均值, 标准差)比较
Table 6 Performance comparison of U-Net with our CscDTE (For each metric, the mean and standard deviation are listed)
KIRC Jaccard系数 精确率 F1分数 平均边缘距离 均值 标准差 均值 标准差 均值 标准差 均值 标准差 本文方法 0.735 0.054 0.832 0.050 0.846 0.037 22.66 9.51 U-Net 0.642 0.064 0.742 0.093 0.780 0.049 57.78 23.11
下载: 导出CSV
表 7 不同算法在病理数据集上的参数规模
Table 7 Number of parameters of different algorithms on the pathology dataset
方法 本文算法 U-Net CNN3 CNN2 参数规模 184KB 1.75MB 1.97MB 7.04MB
下载: 导出CSV
-
[1] Webster J D, Dunstan R W. Whole-slide imaging and automated image analysis: Considerations and opportunities in the practice of pathology. Veterinary Pathology, 2014, 51(1): 211−223 doi: 10.1177/0300985813503570 [2] Yu K H, Zhang C, Berry G J, Altman R B, Re C, Rubin D L, et al. Predicting non-small cell lung cancer prognosis by fully automated microscopic pathology image features. Nature Communications, 2016, 7(12474): 1−10 [3] 郑强, 董恩清. 窄带主动轮廓模型及在医学和纹理图像局部分割中的应用. 自动化学报, 2013, 39(1): 21−30 doi: 10.1016/S1874-1029(13)60003-8Zheng Qiang, Dong En-Qing. Narrow band active contour model for local segmentation of medical and texture images. Acta Automatica Sinica, 2013, 39(1): 21−30 doi: 10.1016/S1874-1029(13)60003-8 [4] 张帆, 张新红. 基于位错理论的距离正则化水平集图像分割算法. 自动化学报, 2018, 44(5): 943−952Zhang Fan, Zhang Xin-Hong. Distance regularized level set image segmentation algorithm by means of dislocation theory. Acta Automatica Sinica, 2018, 44(5): 943−952 [5] Yan P, Zhou X, Shah M, Wong S T C. Automatic segmentation of high-throughput RNAi fluorescent cellular images. IEEE Transactions on Information Technology in Biomedicine, 2008, 12(1): 109−117 doi: 10.1109/TITB.2007.898006 [6] Al-Kofahi Y, Lassoued W, Lee W, Roysam B. Improved automatic detection and segmentation of cell nuclei in histopathology images. IEEE Transactions on Biomedical Engineering, 2010, 57(4): 841−852 doi: 10.1109/TBME.2009.2035102 [7] Arslan S, Ersahin T, Cetin-Atalay R, Gunduz-Demir C. Attributed relational graphs for cell nucleus segmentation in fluorescence microscopy images. IEEE Transactions on Medical Imaging, 2013, 32(6): 1121−1131 doi: 10.1109/TMI.2013.2255309 [8] Koyuncu C F, Arslan S, Durmaz I, Cetin-Atalay R, Gunduz-Demir C. Smart markers for watershed-based cell segmentation. PLoS One, 2012, 7(11): e48664 doi: 10.1371/journal.pone.0048664 [9] Veta M, Huisman A, Viergever M A, van Diest P J, Pluim J P W. Automatic nuclei segmentation in H&E stained breast cancer histopathology images. PLoS One, 2013,8(7): e70221 doi: 10.1371/journal.pone.0070221 [10] Dong F, Irshad H, Oh E Y, Lerwill M F, Brachtel E F, Jones N C, et al. Computational pathology to discriminate benign from malignant intraductal proliferations of the breast. PLoS One, 2014, 9(12): e114885 doi: 10.1371/journal.pone.0114885 [11] Zhou Y, Chang H, Barner K E, Parvin B. Nuclei segmentation via sparsity constrained convolutional regression. In: Proceedings of the 2015 IEEE International Symposium on Biomedical Imaging. New York, NY, USA: IEEE, 2015. 1284−1287 [12] Zhou Z-H, Feng J. Deep forest: Towards an alternative to deep neural networks. In: Proceedings of the 2017 International Joint Conference on Artificial Intelligence. Melbourne, Australia: Morgan Kaufmann, 2017. 3553−3559 [13] Sironi A, Tekin B, Rigamonti R, Lepetit V, Fua P. Learning separable filters. IEEE Transactions on Pattern Analysis and Machine Intelligence, 2015, 37(1): 94−106 doi: 10.1109/TPAMI.2014.2343229 [14] Sironi A, Lepetit V, Fua P. Multiscale centerline detection by learning a scale-space distance transform. In: Proceedings of the 2014 IEEE Computer Society Conference on Computer Vision and Pattern Recognition. Columbus, OH, USA: IEEE, 2014. 2697−2704 [15] Sironi A, Türetken E, Lepetit V, Fua P. Multiscale centerline detection. IEEE Transactions on Pattern Analysis and Machine Intelligence, 2016, 38(7): 1327−1341 doi: 10.1109/TPAMI.2015.2462363 [16] Song J, Xiao L, Lian Z C. Contour-seed pairs learning-based framework for simultaneously detecting and segmenting various overlapping cells/nuclei in microscopy images. IEEE Transactions on Image Processing, 2018, 27(12): 5759−5774 doi: 10.1109/TIP.2018.2857001 [17] Song J, Xiao L, Molaei M, Lian Z C. Multi-layer boosting sparse convolutional model for generalized nuclear segmentation from histopathology images. Knowledge-Based Systems, 2019, 176: 40−53 doi: 10.1016/j.knosys.2019.03.031 [18] Sulam J, Papyan V, Romano Y, Elad M. Multilayer convolutional sparse modeling: pursuit and dictionary learning. IEEE Transactions on Signal Processing, 2018, 66(15): 4090−4104 [19] Kolda T G, Bader B W. Tensor decompositions and applications. SIAM Review, 2009, 51(3): 455−500 doi: 10.1137/07070111X [20] Wright J, Ma Y, Mairal J, Sapiro G, Huang T S, Yan S. Sparse representation for computer vision and pattern recognition. Proceedings of the IEEE, 2010, 98(6): 1031−1044 doi: 10.1109/JPROC.2010.2044470 [21] Rigamonti R, Brown M, Lepetit V. Are sparse representations really relevant for image classification. In: Proceedings of the 2011 IEEE Computer Society Conference on Computer Vision and Pattern Recognition. Providence, RI, USA: IEEE, 2011. 1545−1552 [22] Bach F, Jenatton R, Mairal J, Obozienski G. Optimization with sparsity-inducing penalties. Foundations and Trends in Machine Learning, 2012, 4(1): 1−106 [23] Xu J, Xiang L, Liu Q, Gilmore H, Wu J, Tang J, et al. Stacked sparse autoencoder (SSAE) for nuclei detection on breast cancer histopathology images. IEEE Transactions on Medical Imaging, 2016, 35(1): 119−130 doi: 10.1109/TMI.2015.2458702 [24] Xing F, Xie Y, Yang L. An automatic learning-based framework for robust nucleus segmentation. IEEE Transactions on Medical Imaging, 2016, 5(2): 550−566 [25] Kumar N, Verma R, Sharma S, Bhargava S, Vahadane A, Sethi A. A dataset and a technique for generalized nuclear segmentation for computational pathology. IEEE Transactions on Medical Imaging, 2017, 36(7): 1550−1560 doi: 10.1109/TMI.2017.2677499 [26] Zhang L, Sonka M, Lu L, Summers R M, Yao J. Combining fully convolutional networks and graph-based approach for automated segmentation of cervical cell nuclei. In: Proceedings of the 2017 IEEE International Symposium on Biomedical Imaging. Melbourne, VIC, Australia: IEEE, 2017. 406−409 [27] Ronneberger O, Fischer P, Brox T. U-net: Convolutional networks for biomedical image segmentation. In: Proceedings of Medical Image Computing and Computerassisted Intervention: MICCAI International Conference on Medical Image Computing and Computer-assisted Intervention. Berlin Heidelberg: Springer, 2015. 234−241 [28] Krizhevsky A, Sutskever I, Hinton G E. Imagenet classification with deep convolutional neural networks. In: Proceedings of Advances in Neural Information Processing Systems 25: Proceedings of the 2012 Conference. Cambridge: MIT Press, 2012. 1097−1105 [29] Shelhamer E, Long J, Darrell T. Fully convolutional networks for semantic segmentation. IEEE Transactions on Pattern Analysis and Machine Intelligence, 2017, 39(4): 640−651 doi: 10.1109/TPAMI.2016.2572683 [30] Acar E, Dunlavy D M, Kolda T G. A scalable optimization approach for fitting canonical tensor decompositions. Journal of Chemometrics, 2011, 25(2): 67−86 doi: 10.1002/cem.1335 [31] Lin M, Chen Q, Yan S. Network In Network. In: Proceedings of the 2014 International Conference on Learning Representations. Banff, AB, Canada: OpenReview, 2014. 1−10 [32] Hastie T, Tibshirani R, Friedman J. The elements of statistical learning. New York, NY, USA, Berlin Heidelberg: Springer, 2001 [33] Rokach L. Ensemble-based classifiers. Artificial Intelligence Review, 2010, 33(1-2): 1−39 doi: 10.1007/s10462-009-9124-7 [34] Chen T, Guestrin C. XGBoost: a scalable tree boosting system. In: Proceedings of the 22nd ACM SIGKDD International Conference on Knowledge Discovery and Data Mining. San Francisco, CA, USA: ACM, 2016. 785−794 [35] Tu Z, Bai X. Auto-context and its application to high-level vision tasks and 3D brain image segmentation. IEEE Transactions on Pattern Analysis and Machine Intelligence, 2010, 32(10): 1744−1757 doi: 10.1109/TPAMI.2009.186 [36] Irshad H, Montaser-Kouhsari L, Waltz G, Bucur O, Nowak J A, Dong F, Knoblauch N W, Beck A H. Crowdsourcing image annotation for nucleus detection and segmentation in computational pathology: evaluating experts, automated methods, and the crowd, In: Proceedings of Pacific Symposium on Biocomputing, Fairmont Orchid, Hawaii, USA: PSB, 2014. 294−305 [37] Mairal J, Bach F, Ponce J. Task-driven dictionary learning. IEEE Transactions on Pattern Analysis and Machine Intelligence, 2012, 34(4): 791−804 doi: 10.1109/TPAMI.2011.156 [38] McDonald J H. Handbook of biological statistics. Baltimore, MD: Sparky House, 2014. -

 下载:
下载:


计量
- 文章访问数: 1741
- HTML全文浏览量: 736
- PDF下载量: 268
- 被引次数: 0
