

An Ant Colony Optimization Algorithm Merged With Multiple Source Information for Learning Brain Effective Connectivity Networks
-
摘要: 脑效应连接(Effective connectivity, EC)网络是人脑连接组研究中一项重要的研究课题, 识别脑效应连接网络已成为评价正常脑功能及其与神经退化疾病相关损伤的一种有效手段. 针对从功能性磁共振成像数据中进行脑效应连接网络的学习问题, 提出了一种将多源信息与蚁群优化过程相融合的学习方法. 新方法首先利用弥散张量成像数据获取感兴趣区域的结构约束信息, 并利用正相关的皮尔森信息来压缩蚁群搜索的空间, 以避免蚁群的许多不必要的搜索; 然后在蚁群随机搜索中通过将体素联合激活信息融合于启发函数中, 以增强蚂蚁搜索的目的性, 改进算法的优化效率. 实验结果验证了所提策略的有效性, 与最新的同类算法相比, 新算法在保持较快收敛速度的前提下, 具有更好的求解质量.Abstract: The research of brain effective connectivity (EC) networks is an important topic within the community of human brain connectome, where identifying brain EC networks from neuroimaging data has become an effective tool which can evaluate normal brain functions and their injuries associated with neurodegenerative diseases. For learning brain EC networks from functional magnetic resonance imaging data, this paper proposes an ant colony optimization algorithm merged with multiple source information, called ACOMM-EC. First, the new algorithm employs diffusion tensor imaging data to acquire anatomical constraint information among regions of interest (ROIs), and uses Pearson positive correlated information to restrict the search spaces of feasible solutions so that many unnecessary searches of ants can be avoided. And then, by combining the joint active information between two nodes of an arc and the original heuristic function, a new heuristic function with a better heuristic ability is given to induct the process of stochastic searches, which enhances the purpose of ants searching, and improves the optimization efficiency. Finally, the algorithm is tested on different data and compared with some recently proposed algorithms. The results show that the two strategies are effective, and the solution quality of the new algorithm precedes the other algorithms while the convergence speed is faster.
-
Key words:
- Brain effective connectivity network /
- ant colony optimization /
- multiple source information fusion /
- search space compression /
- heuristic function revision
1) 本文责任编委 张军平 -
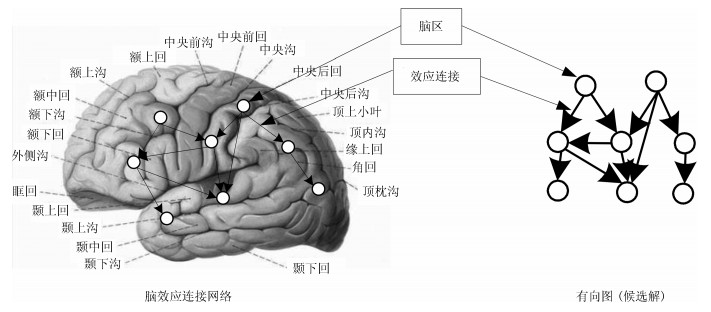
图 1 脑效应连接网络与相应候选解的对应关系
Fig. 1 The mapping relationship between EC and its corresponding candidate solution

图 2 ACOMM-EC算法学习脑效应连接网络的流程图
Fig. 2 The main process of learning an effective connectivity network by ACOMM-EC
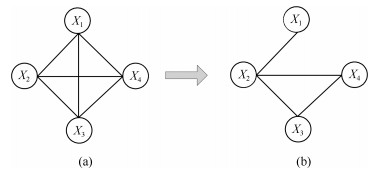
图 3 带有4个节点的初始候选连接图的变化事例
Fig. 3 An example of the change of initial candidate connection diagram with 4 nodes

图 4 节点$X_4$的侯选父母节点集组成的搜索空间的变化示例
Fig. 4 An example of the change of initial candidate connection diagram with 4 nodes

图 6 在Sim1-1上标准网络和7种算法学习到的脑效应连接网络对比图
Fig. 6 The comparisons of ground-truth and effective connectivity network learned by 7 algorithms on Sim1-1
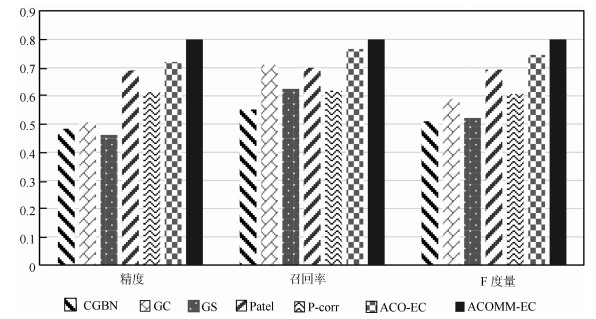
图 7 7种算法在所有仿真数据集上的平均实验结果
Fig. 7 The average results of 7 methods on all simulated dataset
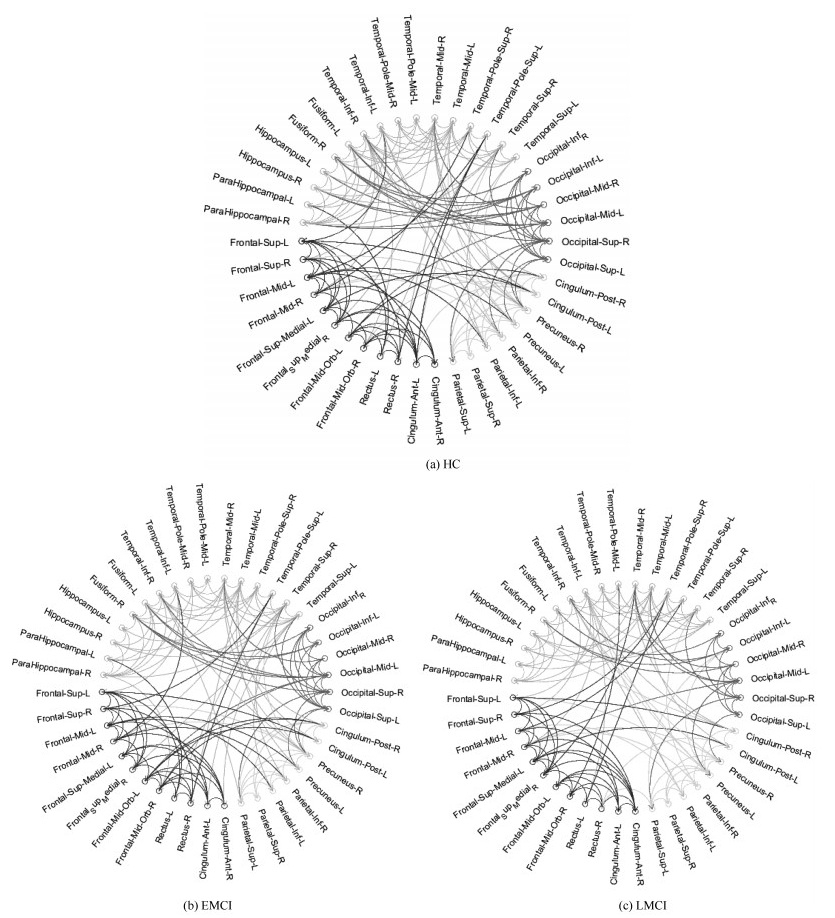
图 8 ACOMM-EC算法学习到的脑效应连接网络连接图
Fig. 8 The connectograms of effective connectivity learned by ACOMM-EC
表 1 仿真数据集参数
Table 1 The parameters of Smith's simulation datasets
Simulation Nodes Session (s) TR (s) Noise (%) HRF (s) Subjects Sim1-1 5 600 3.00 1.0 0.5 50 Sim1-2 10 600 3.00 1.0 0.5 50 Sim1-3 15 600 3.00 1.0 0.5 50 Sim1-4 50 600 3.00 1.0 0.5 50  下载: 导出CSV
表 2 DCM模型生成仿真数据集参数
Table 2 The parameters of DCM model generates simulated datasets
Simulation Nodes Session (s) TR (s) Noise (%) HRF (s) Subjects Sim2-1 5 600 3.00 3.0 0.5 50 Sim2-2 10 600 3.00 3.0 0.5 50 Sim2-3 15 600 3.00 3.0 0.5 50 Sim2-4 50 600 3.00 3.0 0.5 50 Sim2-5 100 600 3.00 3.0 0.5 50 Sim2-6 200 600 3.00 3.0 0.5 50
下载: 导出CSV
表 3 HC, EMCI和LMCI的统计特性
Table 3 The demographic Information of the HC, EMCI and LMCI
HC EMCI LMCI 人数 20 15 15 性别(男/女) 4/16 10/5 7/8 年龄 $71.2\pm13.8$ $74.9\pm8.3$ $78.4\pm13.4$
下载: 导出CSV
表 4 感兴趣区域名称
Table 4 The names of the ROIs
编号 名称 编号 名称 额叶 1 左背外侧额上回(Frontal_Sup_L) 7 左框内额上回(Frontal_Med_Orb_L) 2 右背外侧额上回(Frontal_Sup_R) 8 右框内额上回(Frontal_Med_Orb_R) 3 左额中回(Frontal_Mid_L) 9 左回直肌(Rectus_L) 4 右额中回(Frontal_Mid_R) 10 右回直肌(Rectus_R) 5 左内侧额上回(Frontal_Sup_Medial_L) 11 左前扣带和旁扣带脑回(Cingulum_Ant_L) 6 右内侧额上回(Frontal_Sup_Medial_R) 12 右前扣带和旁扣带脑回(Cingulum_Ant_R) 顶叶 13 左顶上回(Parietal_Sup_L) 17 左楔前叶(Precuneus_L) 14 右顶上回(Parietal_Sup_R) 18 右楔前叶(Precuneus_R) 15 左顶下缘角回(Parietal_Inf_L) 19 左后扣带回(Cingulum_Post_L) 16 右顶下缘角回(Parietal_Inf_R) 20 右后扣带回(Cingulum_Post_R) 枕叶 21 左枕上回(Occipital_Sup_L) 24 右枕中回(Occipital_Mid_R) 22 右枕上回(Occipital_Sup_R) 25 左枕下回(Occipital_Inf_L) 23 左枕中回(Occipital_Mid_L) 26 右枕下回(Occipital_Inf_R) 颞叶 27 左颞上回(Temporal_Sup_L) 35 左颞下回(Temporal_Inf_L) 28 右颞上回(Temporal_Sup_R) 36 右颞下回(Temporal_Inf_R) 29 左颞上回颞极(Temporal_Pole_Sup_L) 37 左梭状回(Fusiform_L) 30 右颞上回颞极(Temporal_Pole_Sup_R) 38 右梭状回(Fusiform_R) 31 左颞中回(Temporal_Mid_L) 39 左海马(Hippocampus_L) 32 右颞中回(Temporal_Mid_R) 40 右海马(Hippocampus_R) 33 左颞中回颞极(Temporal_Pole_Mid_L) 41 左海马旁回(ParaHippocampal_L) 34 右颞中回颞极(Temporal_Pole_Mid_R) 42 右海马旁回(ParaHippocampal_R)
下载: 导出CSV
表 5 在Smith仿真数据集上两种新策略的效果
Table 5 The effectiveness of the two new strategies on Smith's simulation datasets
数据集 算法 精度 召回率 F度量 时间(s) Sim1-1 ACO-EC 1 1 1 $0.36\pm0.02$ ACO-EC1 1 1 1 $0.36\pm0.02$ ACO-EC2 1 1 1 $0.38\pm0.02$ Sim1-2 ACO-EC $0.89\pm0.06$ $0.89\pm0.06$ $0.89\pm0.06$ $2.81\pm0.09$ ACO-EC1 $0.89\pm0.06$ $0.89\pm0.06$ $0.89\pm0.06$ $1.54\pm0.08$ ACO-EC2 $0.91\pm0.06$ $0.91\pm0.06$ $0.91\pm0.06$ $2.63\pm0.09$ Sim1-3 ACO-EC $0 .86\pm0.07$ $0.86\pm0.07$ $0.86\pm0.07$ $10.11\pm0.32$ ACO-EC1 $0.86\pm0.07$ $0.86\pm0.07$ $0.86\pm0.07$ $6.78\pm0.27$ ACO-EC2 $0.87\pm0.07$ $0.87\pm0.07$ $0.87\pm0.07$ $9.86\pm0.25$ Sim1-4 ACO-EC $0.80\pm0.07$ $0.80\pm0.07$ $0.80\pm0.07$ $353.44\pm21.63$ ACO-EC1 $0.80\pm0.07$ $0.80\pm0.07$ $0.80\pm0.07$ $181.84\pm16.19$ ACO-EC2 $0.82\pm0.07$ $0.82\pm0.07$ $0.82\pm0.07$ $264.35\pm18.27$
下载: 导出CSV
表 6 在生成的高噪声仿真数据集上两种新策略的效果
Table 6 The effectiveness of the two new strategies on generated simulated datasets with higher noises
数据集 算法 精度 召回率 F度量 时间(s) Sim2-1 ACO-EC 1 1 1 $0.38\pm0.02$ ACO-EC1 1 1 1 $0.38\pm0.02$ ACO-EC2 1 1 1 $0.38\pm0.02$ Sim2-2 ACO-EC $0.77\pm0.08$ $0.77\pm0.08$ $0.77\pm0.08$ $2.97\pm0.12$ ACO-EC1 $0.77\pm0.08$ $0.77\pm0.08$ $0.77\pm0.08$ $1.69\pm0.09$ ACO-EC2 $0.81\pm0.07$ $0.81\pm0.07$ $0.81\pm0.07$ $2.87\pm0.13$ Sim2-3 ACO-EC $0.72\pm0.08$ $0.74\pm0.08$ $0.73\pm0.08$ $12.24\pm0.41$ ACO-EC1 $0.75\pm0.08$ $0.75\pm0.08$ $0.75\pm0.08$ $7.43\pm0.29$ ACO-EC2 $0.75\pm0.07$ $0.78\pm0.07$ $0.76\pm0.07$ $11.01\pm0.35$ Sim2-4 ACO-EC $0.63\pm0.08$ $0.70\pm0.08$ $0.67\pm0.08$ $431.29\pm24.80$ ACO-EC1 $0.70\pm0.08$ $0.70\pm0.08$ $0.70\pm0.08$ $197.38\pm18.14$ ACO-EC2 $0.65\pm0.07$ $0.76\pm0.07$ $0.71\pm0.07$ $382.74\pm22.85$
下载: 导出CSV
表 7 在更大规模脑网络生成数据集上两种新策略的效果
Table 7 The effectiveness of the two new strategies on generated simulated datasets with larger scale networks
数据集 算法 精度 召回率 F度量 时间(s) Sim2-5 ACO-EC $0.61\pm0.08$ $0.69\pm0.08$ $0.65\pm0.08$ $(1.79\pm0.13)\times10^{3}$ ACO-EC1 $0.70\pm0.08$ $0.70\pm0.08$ $0.70\pm0.08$ $(8.68\pm0.76)\times10^{2}$ ACO-EC2 $0.66\pm0.07$ $0.73\pm0.07$ $0.70\pm0.07$ $(1.54\pm0.10)\times10^{3}$ Sim2-6 ACO-EC $0.59\pm0.09$ $0.69\pm0.09$ $0.64\pm0.09$ $(1.55\pm0.15)\times10^{4}$ ACO-EC1 $0.68\pm0.09$ $0.68\pm0.09$ $0.68\pm0.09$ $(4.72\pm0.38)\times10^{3}$ ACO-EC2 $0.64\pm0.07$ $0.71\pm0.07$ $0.68\pm0.07$ $(1.27\pm0.12)\times10^{4}$
下载: 导出CSV
表 8 ACOMM-EC算法和其他6种算法在Smith仿真数据上的实验对比
Table 8 The comparisons of ACOMM-EC and other six algorithms on Smith's simulated datasets
数据集 评价指标 CGBN GC GS Patel P-corr ACO-EC ACOMM-EC Sim1-1 精度 0.33 0.83 0.60 0.80 0.80 1 1 召回率 0.4 1 0.60 0.80 0.80 1 1 F度量 0.36 0.91 0.60 0.80 0.80 1 1 时间(s) 0.04 1.98 125.56 0.04 72.38 $0.36\pm0.02$ $0.36\pm0.02$ Sim1-2 精度 0.27 0.64 0.82 0.82 0.82 $0.89\pm0.06$ $0.92\pm0.06$ 召回率 0.29 0.64 0.82 0.82 0.82 $0.89\pm0.06$ $0.92\pm0.06$ F度量 0.28 0.64 0.82 0.82 0.82 $0.89\pm0.06$ $0.92\pm0.06$ 时间(s) 0.09 7.87 543.78 0.18 86.99 $2.81\pm0.09$ $1.47\pm0.08$ Sim1-3 精度 0.33 0.63 0.89 0.80 0.56 $0.86\pm0.07$ $0.87\pm0.06$ 召回率 0.33 0.67 0.89 0.89 0.56 $0.86\pm0.07$ $0.87\pm0.06$ F度量 0.33 0.65 0.89 0.84 0.56 $0.86\pm0.07$ $0.87\pm0.06$ 时间(s) 1.35 17.79 $1.30\times10^{3}$ 0.39 131.41 $10.11\pm0.32$ $6.15\pm0.26$ Sim1-4 精度 0.44 0.55 0.79 0.77 0.56 $0.80\pm0.07$ $0.82\pm0.06$ 召回率 0.44 0.61 0.79 0.77 0.57 $0.80\pm0.07$ $0.82\pm0.06$ F度量 0.44 0.58 0.79 0.77 0.56 $0.80\pm0.07$ $0.82\pm0.06$ 时间(s) 4.03 200.34 $1.48\times10^{4}$ 4.55 466.29 $353.44\pm21.63$ $164.45\pm13.24$
下载: 导出CSV
表 9 ACOMM-EC算法和其他6种算法在生成仿真数据上的实验对比
Table 9 The comparisons of ACOMM-EC and other six algorithms on generated simulated datasets
数据集 评价指标 CGBN GC GS Patel P-corr ACO-EC ACOMM-EC Sim2-1 精度 0.50 0.60 0.50 1 1 1 1 召回率 0.60 1 0.60 1 0.6 1 1 F度量 0.55 0.75 0.55 1 0.75 1 1 时间(s) 0.09 2.17 123.48 0.04 85.01 $0.38\pm0.02$ $0.38\pm0.02$ Sim2-2 精度 0.46 0.59 0.55 0.64 0.63 $0.77\pm0.08$ $0.81\pm0.07$ 召回率 0.60 0.91 0.55 0.64 0.91 $0.77\pm0.08$ $0.81\pm0.07$ F度量 0.52 0.71 0.55 0.64 0.74 $0.77\pm0.08$ $0.81\pm0.07$ 时间(s) 0.11 4.05 539.42 0.21 94.40 $2.97\pm0.12$ $1.63\pm0.08$ Sim2-3 精度 0.55 0.59 0.50 0.71 0.48 $0.72\pm0.08$ $0.78\pm0.06$ 召回率 0.64 0.74 0.59 0.71 0.59 $0.74\pm0.08$ $0.78\pm0.06$ F度量 0.59 0.67 0.54 0.71 0.53 $0.73\pm0.08$ $0.78\pm0.06$ 时间(s) 1.26 11.97 $1.26\times10^{3}$ 0.50 208.92 $12.24\pm0.41$ $6.86\pm0.25$ Sim2-4 精度 0.41 0.42 0.41 0.56 0.51 $0.63\pm0.08$ $0.76\pm0.06$ 召回率 0.41 0.53 0.71 0.59 0.53 $0.70\pm0.08$ $0.76\pm0.06$ F度量 0.41 0.47 0.51 0.57 0.52 $0.67\pm0.08$ $0.76\pm0.06$ 时间(s) 3.93 134.78 $1.54\times10^{4}$ 3.66 490.57 $431.29\pm24.80$ $125.47\pm16.122$ Sim2-5 精度 0.50 0.52 0.45 0.60 0.53 $0.61\pm0.08$ $0.74\pm0.07$ 召回率 0.53 0.54 0.65 0.63 0.54 $0.70\pm0.08$ $0.74\pm0.07$ F度量 0.51 0.53 0.53 0.61 0.56 $0.66\pm0.08$ $0.74\pm0.07$ 时间(s) 21.59 568.04 $6.28\times10^{4}$ 15.22 $1.06\times10^{3}$ $(1.79\pm0.13)\times10^{3}$ $545.27\pm62.19$ Sim2-6 精度 0.48 0.32 0.36 0.63 0.53 $0.59\pm0.09$ $0.71\pm0.07$ 召回率 0.53 0.54 0.65 0.63 0.54 $0.69\pm0.09$ $0.71\pm0.07$ F度量 0.48 0.41 0.45 0.63 0.54 $0.64\pm0.09$ $0.71\pm0.07$ 时间(s) 150.18 $2.39\times10^{3}$ $2.48\times10^{5}$ 58.82 $2.43\times10^{3}$ $(1.55\pm0.15)\times10^{4}$ $(2.26\pm0.22) \times10^{3}$
下载: 导出CSV
表 10 HC、EMCI和LMCI三组脑叶内与脑叶间脑效应连接的数量统计
Table 10 The intra and interlobe effective connectivity statistics for HC、EMCI and LMCI groups
分组 脑区 额叶 顶叶 枕叶 颞叶 HC 额叶 30 10 1 13 顶叶 15 5 12 枕叶 14 14 颞叶 45 EMCI 额叶 29 9 2 12 顶叶 14 4 9 枕叶 13 10 颞叶 43 LMCI 额叶 29 8 2 9 顶叶 13 5 10 枕叶 10 8 颞叶 39
下载: 导出CSV
-
[1] Lehrer J. Neuroscience: making connections. Nature News, 2009, 457(7229): 524-527 doi: 10.1038/457524a [2] 梁夏, 王金辉, 贺永. 人脑连接组研究: 脑结构网络和脑功能网络. 科学通报, 2010, 55(16): 1565-1583 https://www.cnki.com.cn/Article/CJFDTOTAL-KXTB201016008.htmLiang Xia, Wang Jin-Hui, He Yong. Human connectome: Structural and functional brain networks. Chinese Science Bulletin, 2010, 55(16): 1565-1583 https://www.cnki.com.cn/Article/CJFDTOTAL-KXTB201016008.htm [3] 左西年, 张喆, 贺永, 等. 人脑功能连接组: 方法学、发展轨线和行为关联. 科学通报, 2012, 57(35): 3399-3413 https://www.cnki.com.cn/Article/CJFDTOTAL-KXTB201235009.htmZuo Xi-Nian, Zhang Zhe, He Yong, et al. The human functional conncetome: Its methodology, developmental trajectory and behavioral association. Chinese Science Bulletin, 2012, 57(35): 3399-3413 https://www.cnki.com.cn/Article/CJFDTOTAL-KXTB201235009.htm [4] Warnick R, Guindani M, Erhardt E, et al. A Bayesian approach for estimating dynamic functional network connectivity in fMRI data. Journal of the American Statistical Association, 2018, 113(521): 134-151 doi: 10.1080/01621459.2017.1379404 [5] Pallarés V, Insabato A, Sanjuän A, et al. Extracting orthogonal subject-and condition-specific signatures from fMRI data using whole-brain effective connectivity. Neuroimage, 2018, 178: 238-254 doi: 10.1016/j.neuroimage.2018.04.070 [6] Smith S M, Miller K L, Salimi-Khorshidi G, et al. Network modelling methods for FMRI. Neuroimage, 2011, 54(2): 875-891 doi: 10.1016/j.neuroimage.2010.08.063 [7] Scherr M, Utz L, Tahmasian M, et al. Effective connectivity in the default mode network is distinctively disrupted in Alzheimer's disease - a simultaneous resting-state FDG-PET/fMRI study. Human Brain Mapping, 2019. [8] Liu J, Ji J, Zhang A, Liang P. An ant colony optimization algorithm for learning brain effective connectivity network from fMRI data. In: Proceedings of the 2016 IEEE International Conference on Bioinformatics and Biomedicine (BIBM). Shenzhen, China: IEEE, 2016. 360-367 [9] Seth A K. A MATLAB toolbox for Granger causal connectivity analysis. Journal of Neuroscience Methods, 2010, 186(2): 262-273 doi: 10.1016/j.jneumeth.2009.11.020 [10] Goebel R, Roebroeck A, Kim D S, et al. Investigating directed cortical interactions in time-resolved fMRI data using vector autoregressive modeling and Granger causality mapping. Magnetic Resonance Imaging, 2003, 21(10): 1251-1261 doi: 10.1016/j.mri.2003.08.026 [11] Xu L, Fan T, Wu X, et al. A pooling-LiNGAM algorithm for effective connectivity analysis of fMRI data. Frontiers in Computational Neuroscience, 2014, 8: 125 [12] Shimizu S, Hoyer P O, Hyvarinen A, et al. A linear non-Gaussian acyclic model for causal discovery. Journal of Machine Learning Research, 2006, 7(Oct): 2003-2030 [13] Shimizu S, Kano Y. Use of non-normality in structural equation modeling: Application to direction of causation. Journal of Statistical Planning and Inference, 2008, 138(11): 3483-3491 doi: 10.1016/j.jspi.2006.01.017 [14] Quiroga R Q, Kraskov A, Kreuz T, et al. Performance of different synchronization measures in real data: A case study on electroencephalographic signals. Physical Review E, 2002, 65(4): 041903 doi: 10.1103/PhysRevE.65.041903 [15] Dauwels J, Vialatte F, Musha T, et al. A comparative study of synchrony measures for the early diagnosis of Alzheimer's disease based on EEG. NeuroImage, 2010, 49(1): 668-693 doi: 10.1016/j.neuroimage.2009.06.056 [16] Patel R S, Bowman F D B, Rilling J K. A Bayesian approach to determining connectivity of the human brain. Human Brain Mapping, 2006, 27(3): 267-276 doi: 10.1002/hbm.20182 [17] Ide J S, Zhang S, Chiang-shan R L. Bayesian network models in brain functional connectivity analysis. International Journal of Approximate Reasoning, 2014, 55(1): 23-35 doi: 10.1016/j.ijar.2013.03.013 [18] Mumford J A, Ramsey J D. Bayesian networks for fMRI: a primer. Neuroimage, 2014, 86: 573-582 doi: 10.1016/j.neuroimage.2013.10.020 [19] Meek, C. Causal inference and causal explanation with background knowledge. In: Proceedings of the Eleventh conference on Uncertainty in artificial intelligence (UAI-95). Morgan Kaufmann, San Mateo, CA, USA: Morgan Kaufmann Publishers Inc, 1995. 403-410 [20] Richardson T, Spirtes P. Automated discovery of linear feedback models. Carnegie Mellon: Department of Philosophy, 1996. [21] Ramsey J, Zhang J, Spirtes P L. Adjacency-faithfulness and conservative causal inference. In: Proceedings of the 22nd Convergence on Uncertainty in Artificial Intelligence (UAI), 2006. 401-408 [22] Zhang J. On the completeness of orientation rules for causal discovery in the presence of latent confounders and selection bias. Artificial Intelligence, 2008, 172(16): 1873-1896 [23] Chickering D M. Optimal structure identification with greedy search. Journal of Machine Learning Research, 2002, 3(Nov): 507-554 [24] Ramsey J D, Hanson S J, Hanson C, et al. Six problems for causal inference from fMRI. Neuroimage, 2010, 49(2): 1545-1558 doi: 10.1016/j.neuroimage.2009.08.065 [25] Chiang S, Guindani M, Yeh H J, et al. Bayesian vector autoregressive model for multi-subject effective connectivity inference using multi-modal neuroimaging data. Human Brain Mapping, 2017, 38(3): 1311-1332 doi: 10.1002/hbm.23456 [26] Dang S, Chaudhury S, Lall B, et al. Tractography-based score for learning effective connectivity from multimodal imaging data using dynamic Bayesian networks. IEEE Transactions on Biomedical Engineering, 2018, 65(5): 1057-1068 [27] Martens D, De Backer M, Haesen R, et al. Classification with ant colony optimization. IEEE Transactions on Evolutionary Computation, 2007, 11(5): 651-665 doi: 10.1109/TEVC.2006.890229 [28] Liao T, Socha K, de Oca M A M, et al. Ant colony optimization for mixed-variable optimization problems. IEEE Transactions on Evolutionary Computation, 2014, 18(4): 503-518 doi: 10.1109/TEVC.2013.2281531 [29] Yang Q, Chen W N, Yu Z, et al. Adaptive multimodal continuous ant colony optimization. IEEE Transactions on Evolutionary Computation, 2017, 21(2): 191-205 doi: 10.1109/TEVC.2016.2591064 [30] Ji J, Zhang H, Hu R, Liu C. A Bayesian network learning algorithm based on independence test and ant colony optimization. Acta Automatica Sinica, 2009, 35(3): 281-288 [31] Zhu D, Zhang T, Jiang X, et al. Fusing DTI and fMRI data: A survey of methods and applications. NeuroImage, 2014, 102: 184-191 doi: 10.1016/j.neuroimage.2013.09.071 [32] Van Den Heuvel M P, Mandl R C W, Kahn R S, et al. Functionally linked resting-state networks reflect the underlying structural connectivity architecture of the human brain. Human Brain Mapping, 2009, 30(10): 3127-3141 doi: 10.1002/hbm.20737 [33] Stutzle T, Dorigo M. A short convergence proof for a class of ant colony optimization algorithms. IEEE Transactions on Evolutionary Computation, 2002, 6(4): 358-365 doi: 10.1109/TEVC.2002.802444 [34] Ji J, Liu J, Liang P, et al. Learning effective connectivity network structure from fMRI data based on artificial immune algorithm. PloS One, 2016, 11(2): e0152600 [35] Ji J, Hu R, Zhang H, et al. A hybrid method for learning Bayesian networks based on ant colony optimization. Applied Soft Computing, 2011, 11(4): 3373-3384 doi: 10.1016/j.asoc.2011.01.009 [36] McGeachie M J, Chang H H, Weiss S T. CGBayesNets: Conditional Gaussian Bayesian network learning and inference with mixed discrete and continuous data. PLoS Computational Biology, 2014, 10(6): e1003676 doi: 10.1371/journal.pcbi.1003676 [37] Xu N, Spreng R N, Doerschuk P C. Initial validation for the estimation of resting-state fmri effective connectivity by a generalization of the correlation approach. Frontiers in Neuroscience, 2017, 11: 271 doi: 10.3389/fnins.2017.00271 [38] Huang S, Li J, Ye J, et al. A sparse structure learning algorithm for Gaussian Bayesian network identification from high-dimensional data. IEEE Transactions on Pattern Analysis and Machine Intelligence, 2013, 35(6): 1328-1342 doi: 10.1109/TPAMI.2012.129 [39] 于乃功, 苑云鹤, 李倜, 蒋晓军, 罗子维. 一种基于海马认知机理的仿生机器人认知地图构建方法. 自动化学报, 2018, 44(1): 52-73 doi: 10.16383/j.aas.2018.c160467Yu Nai-Gong, Yuan Yun-He, Li Ti, Jiang Xiao-Jun, Luo Zi-Wei. A Cognitive map building algorithm by means of cognitive mechanism of hippocampus. Acta Automatica Sinica, 2018, 44(1): 52-73 doi: 10.16383/j.aas.2018.c160467 [40] Zhang H Y, Wang S J, Liu B, et al. Resting brain connectivity: Changes during the progress of Alzheimer disease. Radiology, 2010, 256(2): 598-606 doi: 10.1148/radiol.10091701 -

 下载:
下载:


计量
- 文章访问数: 1439
- HTML全文浏览量: 600
- PDF下载量: 223
- 被引次数: 0
