

Low Density Separation Density Sensitive Distance-based Spectral Clustering Algorithm
-
摘要: 本文提出一种基于低密度分割密度敏感距离的谱聚类算法, 该算法首先使用低密度分割密度敏感距离计算相似度矩阵, 该距离测度通过指数函数和伸缩因子实现放大不同流形体数据间的距离和缩短同一流形体数据间距离的目的, 从而有效反映数据分布的全局一致性和局部一致性特征.另外, 算法通过增加相对密度敏感项来考虑数据的局部分布特征, 从而有效避免孤立噪声和"桥"噪声的影响.文中最后给出了基于SC (Scattering criteria)指标的k近邻图k值选取办法和基于谱熵贡献率的特征向量选取方法.实验部分, 讨论了参数选择对算法性能的影响并给出取值建议, 通过与其他流行谱聚类算法聚类结果的对比分析, 表明本文提出的基于低密度分割密度敏感距离的谱聚类算法聚类性能明显优于其他算法.Abstract: This paper proposes a low density separation density sensitive distance-based spectral clustering algorithm.First, the algorithm applies the low-density separation density sensitive distance to calculate the similarity matrix. By the exponential function and flexibility factor, we can achieve increasing the distance between difierent manifold data and decreasing the distance between the same manifold data, which can efiectively reflect the global consistency and local consistency of data distribution. In addition, by adding relative density sensitive term to take into account the local distribution characteristics of the data, isolated noise and "bridge" noise are efiectively avoided. Finally, we provide the method of selecting k-value of k nearest neighbor graph based on SC (Scattering criteria) index and the method of extracting eigenvector based on spectral entropy contribution rate. In the experimental part, the efiect of parameter selection on the performance of the proposed technique is discussed and some suggestions about the determination of the parameters are given. Compared with the state-of-the-art spectral clustering algorithms, the analysis results demonstrate that the proposed low density separation density sensitive distance-based spectral clustering algorithm performs well on artiflcial and UCI benchmark datasets
-
Key words:
- Spectral clustering /
- low density separation /
- Euclidean distance /
- density sensitive /
- robustness
1) 本文责任编委 曾志刚 -
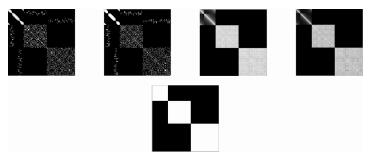
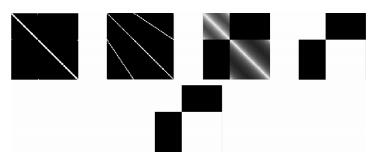
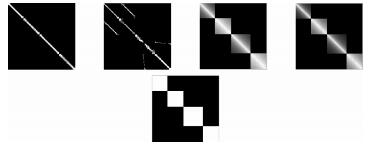
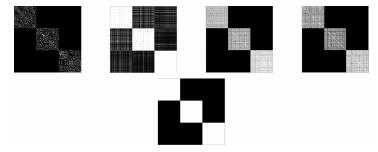
图 4 Cirlcetwopoints (Eyes)数据集相似度矩阵
Fig. 4 Cirlcetwopoints (Eyes) dataset similarity matrix
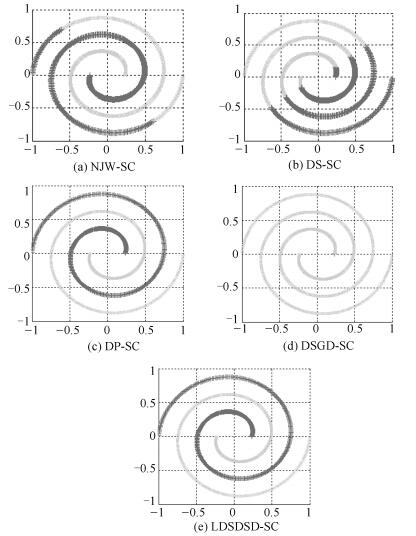
图 7 Spiral数据集5种谱聚类算法的聚类结果图
Fig. 7 Clustering results of five different spectral clustering algorithms on Spiral dataset
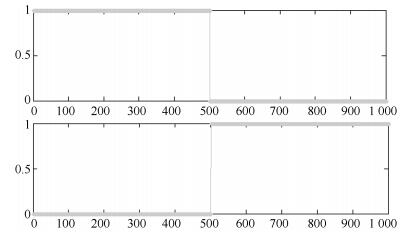
图 8 Spiral数据集前两个特征向量分布情况
Fig. 8 The first two eigenvectors distribution on Spiral dataset
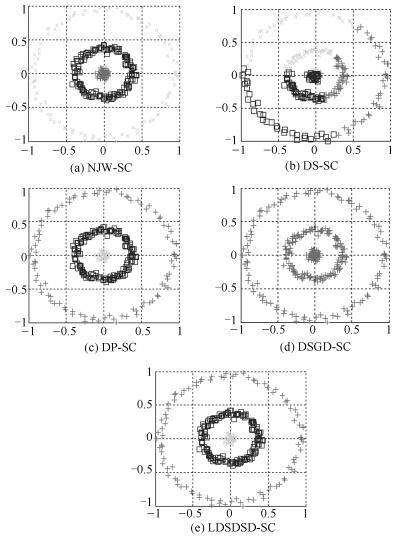
图 9 Three-circles数据集5种谱聚类算法的聚类结果图
Fig. 9 Clustering results of five different spectral clustering algorithms on Three-circles dataset
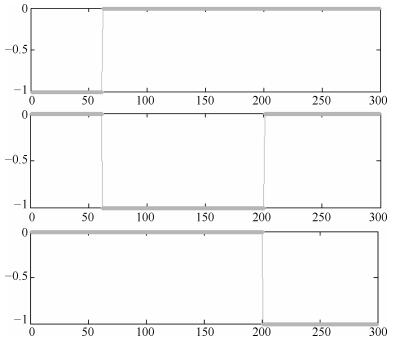
图 10 Three-circles数据集前三个特征向量分布情况
Fig. 10 The first three eigenvectors distribution on Three-circles dataset
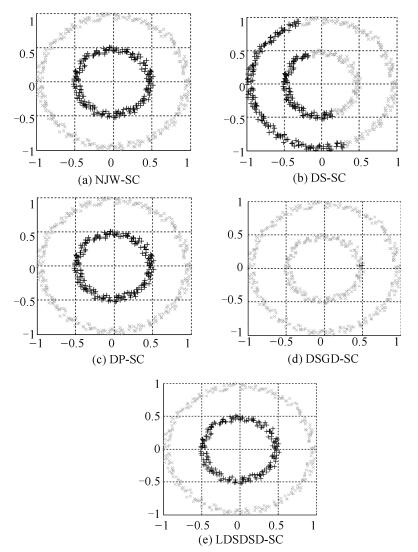
图 11 Ring数据集5种谱聚类算法的聚类结果图
Fig. 11 Clustering results of five different spectral clustering algorithms on Ring dataset
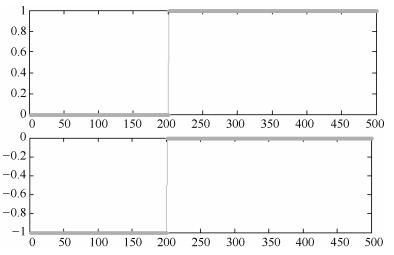
图 12 Ring数据集前两个特征向量分布情况
Fig. 12 The first two eigenvectors distribution on Ring dataset
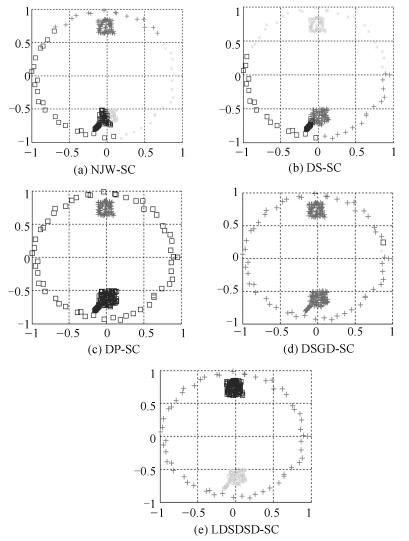
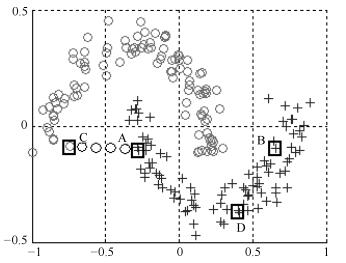
图 13 Eyes数据集5种谱聚类算法的聚类结果图
Fig. 13 Clustering results of five different spectral clustering algorithms on Eyes dataset

图 14 Eyes数据集前三个特征向量分布情况
Fig. 14 The first three eigenvectors distribution on Eyes dataset
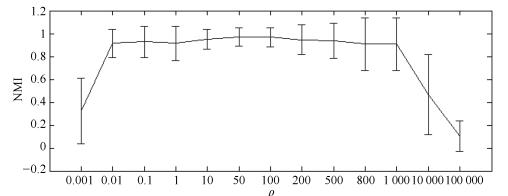
图 15 不同ρ值下8个人工数据集关于NMI的误差棒图
Fig. 15 NMI performance metrics on 8 synthetic datasets with different ρ values
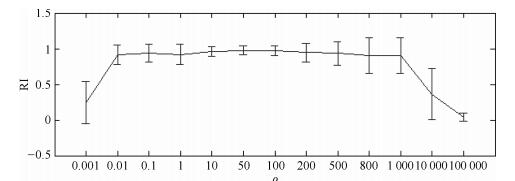
图 16 不同ρ值下8个人工数据集关于RI的误差棒图
Fig. 16 RI performance metrics on 8 synthetic datasets with different ρ values

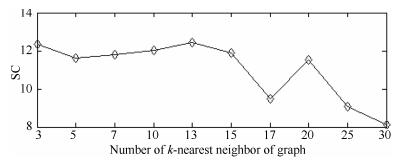
图 17 Square数据集的SC性能指标随k值变化图
Fig. 17 SC performance metric obtained by the proposed approach on Square dataset with different k values
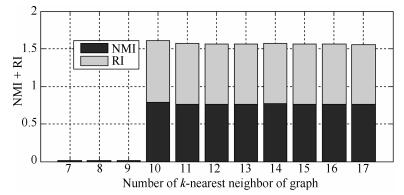
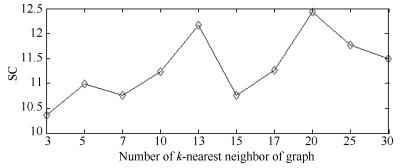
图 18 Square数据集的NMI + RI性能指标随k值变化图
Fig. 18 NMI + RI performance metrics on Square dataset with different k values
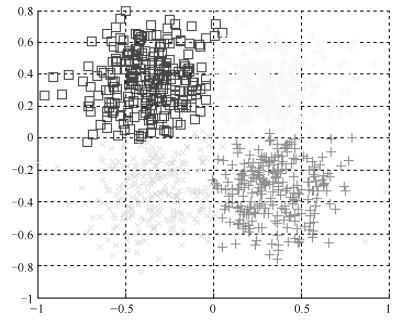
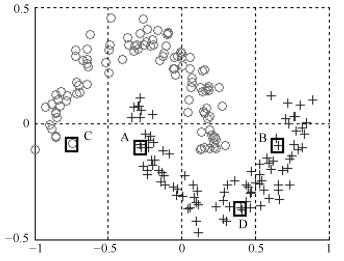
图 19 k = 10时Square数据集聚类的结果图
Fig. 19 The clustering result on Square dataset when k = 10
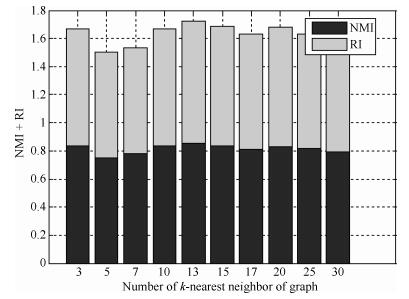
图 21 IRIS数据集的NMI+RI性能指标随k值变化图
Fig. 21 NMI + RI performance metrics on IRIS dataset with different k values
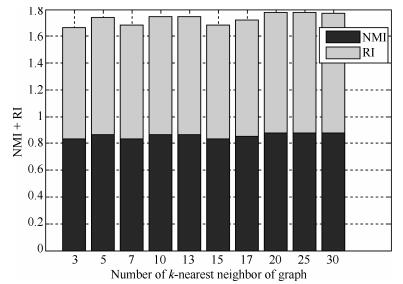
图 23 WINE数据集的NMI+RI性能指标随k值变化图
Fig. 23 NMI + RI performance metrics on WINE dataset with different k values
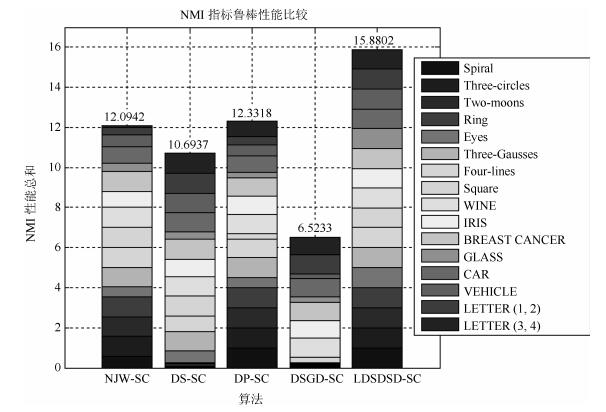
图 24 5种算法的NMI性能指标鲁棒性比较结果
Fig. 24 Comparison results of NMI performance index of five algorithms robustness
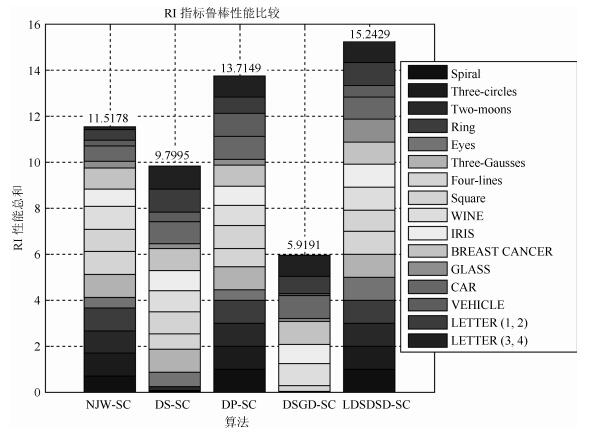
图 25 5种算法的RI性能指标鲁棒性比较结果
Fig. 25 Comparison results of RI performance index of five algorithms robustness
表 1 不同谱聚类算法对8种人工合成数据集关于NMI和RI的统计结果
Table 1 Statistics of different clustering algorithms on eight synthetic datasets in terms of NMI and RI
数据集 NJW-SC DS-SC DP-SC DSGD-SC LDSDSD-SC Spiral 0.5635 ± 0 0.0290 ± 0 1 ± 0 0.0138 ± 0 1 ± 0 0.6720 ± 0 0.0390 ± 0 1 ± 0 8.0080× 10⁻⁶ ± 0 1 ± 0 Three-circles 1 ± 0 0.0456 ± 0 1 ± 0 0.0495 ± 0 1 ± 0 1 ± 0 0.0195 ± 0 1 ± 0 0.0069 ± 0 1 ± 0 Two-moons 0.9595 ± 0 0.1316 ± 0 1 ± 0 0.0334 ± 0 1 ± 0 0.9799 ± 0 0.1722 ± 0 1 ± 0 0.0013 ± 0 1 ± 0 Ring 1 ± 0 0.0277 ± 0 1 ± 0 0.0277 ± 0 1 ± 0 1 ± 0 0.0040 ± 0 1 ± 0 0.0040 ± 0 1 ± 0 Eyes 0.4998 ± 0 0.5913 ± 0 0.5117 ± 0 0.0508 ± 0 1 ± 0 0.4642 ± 0 0.6210 ± 0 0.4366 ± 0 0.0060 ± 0 1 ± 0 Three-Gausses 1 ± 0 1 ± 0 1 ± 0 0.0332 ± 0 1 ± 0 1 ± 0 1 ± 0 1 ± 0 4.4894× 10⁻⁵ ± 0 1 ± 0 Four-lines 1 ± 0 0.7677 ± 0 0.8955 ± 0 0.0293 ± 0 1 ± 0 1 ± 0 0.6729 ± 0 0.7725 ± 0 0.0005 ± 0 1 ± 0 Square 0.7978 ± 0 0.7830 ± 0 0.2335 ± 0.0017 0.2284 ± 0.1978 0.7636 ± 0 0.8348 ± 0 0.8227 ± 0 0.8817 ± 0.1113 0.2054 ± 0.1781 0.8038 ± 0  下载: 导出CSV
表 2 实验数据集描述
Table 2 Description of experimental datasets
数据集 属性 样本个数 聚类数 WINE 13 178 3 IRIS 4 150 3 BREAST CANCER 9 683 2 GLASS 10 214 6 CAR 12 84 8 VEHICLE 18 846 4 LETTER (A, B) 16 1 555 2 LETTER (C, D) 16 1 541 2
下载: 导出CSV
表 3 不同谱聚类算法对8种UCI数据集关于NMI和RI的统计结果
Table 3 Statistics of different clustering algorithms oneight UCI datasets in terms of NMI and RI
数据集 NJW-SC DS-SC DP-SC DSGD-SC LDSDSD-SC WINE 0.8758 ± 0 0.8363 ± 0 0.8335 ± 0.1361 0.8399 ± 0.0640 0.8781 ± 0 (k = 20) 0.8974 ± 0 0.8515 ± 0 0.8116 ± 0.2470 0.8632 ± 0.0660 0.8991 ± 0 (k = 20) IRIS 0.6818 ± 0 0.7549 ± 0 0.7853 ± 0.0115 0.7552 ± 0.3187 0.8571 ± 0(k = 13) 0.6525 ± 0 0.7559 ± 0 0.7276 ± 0.1237 0.7251 ± 0.2611 0.8682 ± 0 (k = 13) BREAST CANCER 0.7903 ± 0 0.8143 ± 0 0.7467 ± 0.2135 0.7478 ± 0 0.7921 ± 0 (k = 20) 0.8796 ± 0 0.8909 ± 0 0.8755 ± 0.1306 0.9487 ± 0 0.8797 ± 0 (k = 20) GLASS 0.3065 ± 0 0.2692 ± 0 0.1913 ± 0.0157 0.1778 ± 0.1488 0.7411 ± 0 (k = 30) 0.1923 ± 0 0.1490 ± 0 0.1515 ± 0.0175 0.1031 ± 0.1196 0.6644 ± 0 (k = 30) CAR 0.6424 ± 0 0.7604 ± 0 0.6457 ± 0.0103 0.7126 ± 0 0.7711 ± 0 (k = 7) 0.3797 ± 0 0.5583 ± 0 0.5773 ± 0.0141 0.5571 ± 0 0.5697 ± 0 (k = 7) VEHICLE 0.1280 ± 0 0.2032 ± 0 0.1125 ± 0.0377 0.0462 ± 0.0220 0.2114 ± 0 (k = 15) 0.1006 ± 0 0.1563 ± 0 0.3759 ± 0.0435 0.0333 ± 0.0167 0.1783 ± 0 (k = 15) LETTER (A, B) 0.2593 ± 0 0.7216 ± 0 0.3103 ± 0.0016 0.7168 ± 0 0.7396 ± 0 (k = 25) 0.3367 ± 0 0.7658 ± 0 0.5667 ± 0.01005 0.5975 ± 0 0.7863 ± 0 (k = 25) LETTER (C, D) 0.0724 ± 0 0.6876 ± 0 0.5517 ± 0.1953 0.6131 ± 0 0.6535 ± 0 (k = 30) 0.0984 ± 0 0.7280 ± 0 0.6505 ± 0.0167 0.6578 ± 0 0.6864 ± 0 (k = 30)
下载: 导出CSV
-
[1] Qin F P, Zhang A W, Wang S M, Meng X G, Hu S X, Sun W D. Hyperspectral band selection based on spectral clustering and inter-class separability factor. Spectroscopy and Spectral Analysis, 2015, 35(5): 1357-1364 http://www.wanfangdata.com.cn/details/detail.do?_type=perio&id=gpxygpfx201505047 [2] Goyal S, Kumar S, Zaveri M A, Shukla A K. Fuzzy similarity measure based spectral clustering framework for noisy image segmentation. International Journal of Uncertainty, Fuzziness and Knowledge-based Systems, 2017, 25(4): 649-673 doi: 10.1142/S0218488517500283 [3] Choy S K, Lam S Y, Yu K W, Lee W Y, Leung K T. Fuzzy model-based clustering and its application in image segmentation. Pattern Recognition, 2017, 68: 141-157 doi: 10.1016/j.patcog.2017.03.009 [4] Akbarizadeh G, Rahmani M. E–cient combination of texture and color features in a new spectral clustering method for PolSAR image segmentation. National Academy Science Letters, 2017, 40(2): 117-120 doi: 10.1007/s40009-016-0513-6 [5] Jang M, Song Y, Chang J W. A parallel computation of skyline using multiple regression analysis-based flltering on MapReduce. Distributed & Parallel Databases, 2017, 35(3-4): 383-409 doi: 10.1007%2Fs10619-017-7202-4 [6] 毛国君, 胡殿军, 谢松燕.基于分布式数据流的大数据分类模型和算法.计算机学报, 2017, 40(1): 161-174 http://www.cnki.com.cn/Article/CJFDTotal-JSJX201701009.htmMao Guo-Jun, Hu Dian-Jun, Xie Song-Yan. Models and algorithms for classifying big data based on distributed data streams. Chinese Journal of Computers, 2017, 40(1):161-174 http://www.cnki.com.cn/Article/CJFDTotal-JSJX201701009.htm [7] Yang Y, Shen F M, Huang Z, Shen H T, Li X L. Discrete nonnegative spectral clustering. IEEE Transactions on Knowledge & Data Engineering, 2017, 29(9): 1834-1845 http://d.old.wanfangdata.com.cn/NSTLQK/NSTL_QKJJ0229585362/ [8] Li Y G, Zhang S C, Cheng D B, He W, Wen G Q, Xie Q. Spectral clustering based on hypergraph and selfre-presentation. Multimedia Tools & Applications, 2017, 76(16): 17559-17576 doi: 10.1007/s11042-016-4131-6 [9] Hosseini M, Azar F T. A new eigenvector selection strategy applied to develop spectral clustering. Multidimensional Systems & Signal Processing, 2017, 28(4): 1227-1248 http://www.wanfangdata.com.cn/details/detail.do?_type=perio&id=af4275750a3d10ae7b759c833dea4232 [10] Tan P N, Steinbach M, Kumar V. Introduction to Data Mining. Boston, MA: Addison Wesley, 2005. http://d.old.wanfangdata.com.cn/OAPaper/oai_doaj-articles_d98deb18ba233ecf3035551441060fbc [11] Liu W F, Ye M, Wei J H, Hu X X. Compressed constrained spectral clustering framework for large-scale data sets. Knowledge-Based Systems, 2017, 135: 77-88 doi: 10.1016/j.knosys.2017.08.003 [12] Zhang R, Nie F P, Li X L. Self-weighted spectral clustering with parameter-free constraint. Neurocomputing, 2017, 241: 164-170 doi: 10.1016/j.neucom.2017.01.085 [13] Li X Y, Guo L J. Constructing a–nity matrix in spectral clustering based on neighbor propagation. Neurocomputing, 2012, 97: 125-130 doi: 10.1016/j.neucom.2012.06.023 [14] Zhan Q, Mao Y. Improved spectral clustering based on Nystr˜om method. Multimedia Tools & Applications, 2017, 76(19): 20149-20165 [15] Chen J S, Li Z Q, Huang B. Linear spectral clustering superpixel. IEEE Transactions on Image Processing, 2017, 26(7):3317-3330 doi: 10.1109/TIP.2017.2651389 [16] 王玲, 薄列峰, 焦李成.密度敏感的谱聚类.电子学报, 2007, 35(8):1577-1581 doi: 10.3321/j.issn:0372-2112.2007.08.030Wang Ling, Bo Lie-Feng, Jiao Li-Cheng. Density-sensitive spectral clustering. Acta Electronica Sinica, 2007, 35(8):1577-1581 doi: 10.3321/j.issn:0372-2112.2007.08.030 [17] 吴健, 崔志明, 时玉杰, 盛胜利, 龚声蓉.基于局部密度构造相似矩阵的谱聚类算法.通信学报, 2013, 34(3): 14-22 doi: 10.3969/j.issn.1001-2400.2013.03.003Wu Jian, Cui Zhi-Ming, Shi Yu-Jie, Sheng Sheng-Li, Gong Sheng-Rong. Local density-based similarity matrix construction for spectral clustering. Journal on Communications, 2013, 34(3): 14-22 doi: 10.3969/j.issn.1001-2400.2013.03.003 [18] Rodriguez A, Laio A. Clustering by fast search and flnd of density peaks. Science, 2014, 344(6191): 1492-1496 doi: 10.1126/science.1242072 [19] Yu J, Kim S B. Density-based geodesic distance for identifying the noisy and nonlinear clusters. Information Sciences, 2016, 360: 231-243 doi: 10.1016/j.ins.2016.04.032 [20] Qian P J, Jiang Y Z, Wang S T, Su K H, Wang J, Hu L Z, et al. A–nity and penalty jointly constrained spectral clustering with all-compatibility, flexibility, and robustness.IEEE Transactions on Neural Networks and Learning Systems, 2017, 28(5): 1123-1138 doi: 10.1109/TNNLS.2015.2511179 [21] Wang B J, Zhang L, Wu C L, Li F Z, Zhang Z. Spectral clustering based on similarity and dissimilarity criterion. Pattern Analysis & Applications, 2017, 20(2): 495-506 http://smartsearch.nstl.gov.cn/paper_detail.html?id=7c07484977c39b92db088a5927d8d238 [22] 周林, 平西建, 徐森, 张涛.基于谱聚类的聚类集成算法.自动化学报, 2012, 38(8): 1335-1342 doi: 10.3724/SP.J.1004.2012.01335Zhou Lin, Ping Xi-Jian, Xu Sen, Zhang Tao. Cluster ensemble based on spectral clustering. Acta Automatica Sinica, 2012, 38(8): 1335-1342 doi: 10.3724/SP.J.1004.2012.01335 [23] 程昊翔, 王坚.基于快速聚类分析的支持向量数据描述算法.控制与决策, 2016, 31(3): 551-554 http://d.old.wanfangdata.com.cn/Periodical/kzyjc201603025Cheng Hao-Xiang, Wang-Jian. Support vector data description based on fast clustering analysis. Control and Decision, 2016, 31(3): 551-554 http://d.old.wanfangdata.com.cn/Periodical/kzyjc201603025 [24] Zhou H D, Shi T L, Liao G L, Xuan J P, Su L, He Z Z, et al. Using supervised Kernel entropy component analysis for fault diagnosis of rolling bearings. Journal of Vibration & Control, 2017, 23(13): 2167-2178 doi: 10.1177/1077546315608724 [25] Yu Y, Wang T, Samworth R J. A useful variant of the DavisKahan theorem for statisticians. Biometrika, 2015, 102(2):315-323 http://www.homepages.ucl.ac.uk/~ucaktwa/publication/DKvariant.pdf [26] Wu T F, Tsai P S, Hu N T, Chen J Y. Combining turning point detection and Dijkstra0s algorithm to search the shortest path. Advances in Mechanical Engineering, 2017, 9(2), doi: 10.1177/1687814016683353 [27] 陶新民, 徐晶, 付强, 刘兴丽.基于样本密度KFCM新算法及其在故障诊断的应用.振动与冲击, 2009, 28(8): 61-64 doi: 10.3969/j.issn.1000-3835.2009.08.013Tao Xin-Min, Xu Jing, Fu Qiang, Liu Xing-Li. Kernel fuzzy C-means algorithm based on distribution density and its application in fault diagnosis. Journal of Vibration and Shock, 2009, 28(8): 61-64 doi: 10.3969/j.issn.1000-3835.2009.08.013 -

 下载:
下载:

计量
- 文章访问数: 1707
- HTML全文浏览量: 239
- PDF下载量: 149
- 被引次数: 0
