

-
摘要: 目前国内主要依靠各种精密仪器检测空气中的污染物浓度.由于仪器的成本较高, 国家通过在每个城市设立监测站来检测空气质量, 这种空气质量检测方法是粗粒度的, 不能覆盖城市的每个角落.本文提出了一种基于图像的空气质量等级检测方法, 旨在通过移动设备采集的图像检测空气质量等级, 移动设备的普及使得通过图像细粒度检测空气质量成为可能, 该方法利用空气污染对图像颜色通道和灰度通道局部信息熵的影响构建空气质量等级检测模型.在本文构建的空气质量图像库进行了模型测试和比较分析, 实验结果表明:本文方法能够准确地评估空气质量等级, 比其他已有相关方法更适用于空气质量等级检测.Abstract: At present, the concentration of pollutants in the air is detected mainly by a variety of precision testing instruments. Because of the high cost of instruments, the state set up monitoring stations in every city to detect air quality, which is coarse-grained and cannot cover every corner of the city. This paper presents an air quality detection method based on images taken by mobile devices. Now the popularity of mobile devices makes it possible for the fine-grained detection of the air quality through images. Our method carries on the analysis of color channel information entropy and gray channel information entropy, which can reflect air quality, and then we build the air quality grade detection model based on these image features. The proposed method is compared with other existing methods on our air quality image database from the estimation accuracy and the time consumption, and the experimental results show that our method is more suitable for air quality grade detection.
-
Key words:
- Air quality grade detection /
- air quality image database /
- fine-grained detection /
- local information entropy
1) 本文责任编委 金连文 -

图 1 基于传统机器学习的空气质量估计模型构建流程
Fig. 1 Air quality estimation model construction process based on traditional machine learning
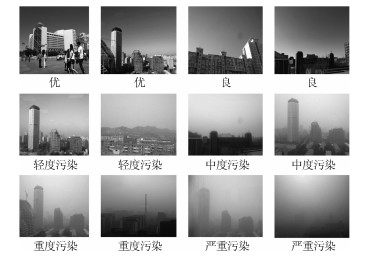
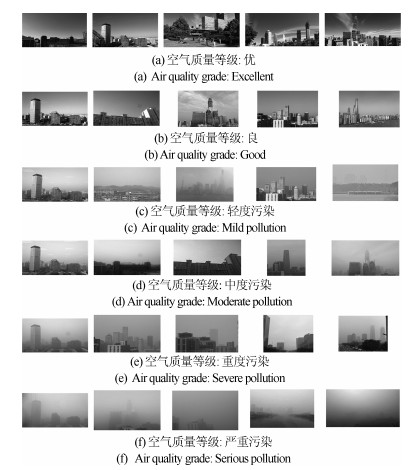
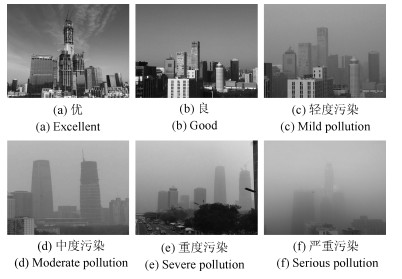
图 2 空气质量图像库中不同等级图像示例
Fig. 2 Examples of images with different grades in the air quality image dataset
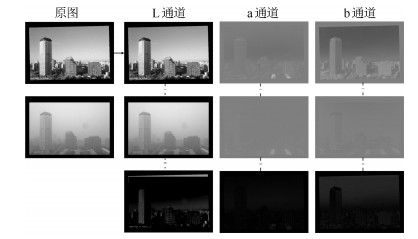
图 3 空气污染对图像灰度通道和彩色通道的影响
Fig. 3 The effect of air pollution on the gray and color channels of images
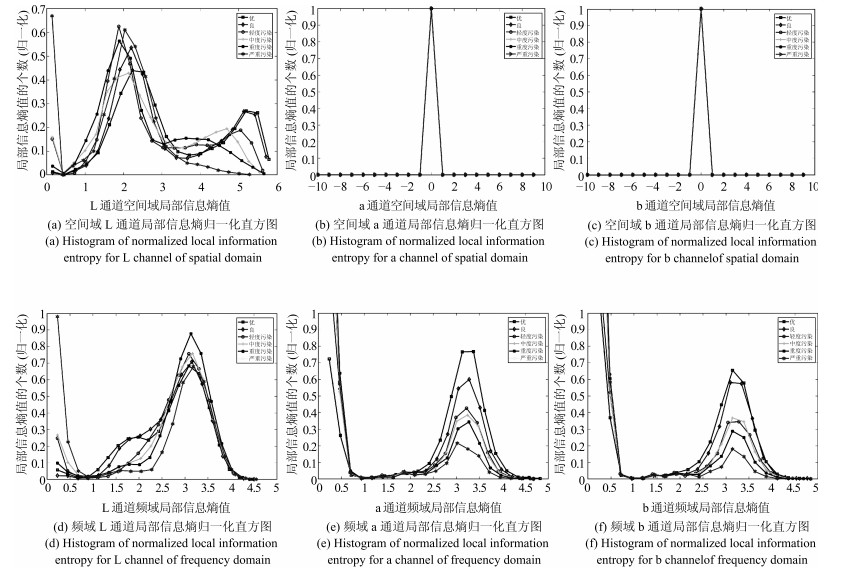
图 5 不同空气质量等级图像局部信息熵归一化直方图
Fig. 5 Histogram of normalized local information entropy for images at different air quality grades
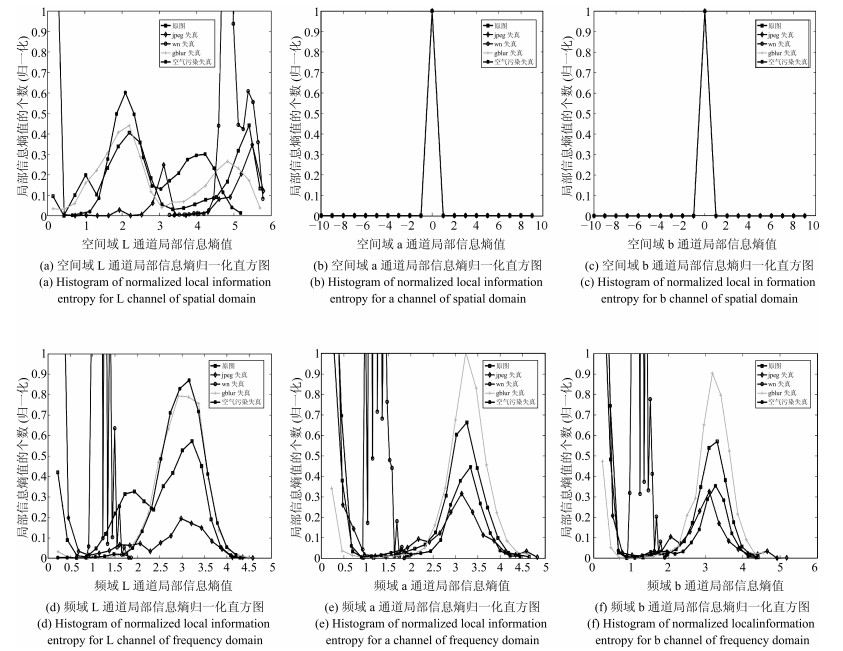
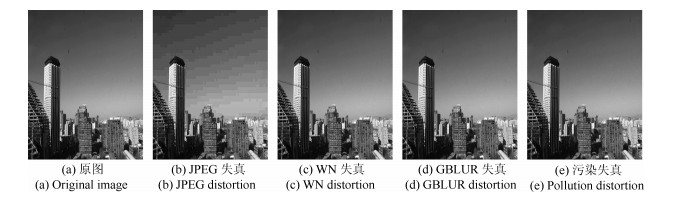
图 7 原图和各种失真图像局部信息熵归一化直方图
Fig. 7 Histogram of normalized local information entropy for the original image and images with different kinds of distortions

图 8 不同空气质量等级在局部信息熵均值和斜率两个特征上的分布
Fig. 8 The average and slope distribution of the local information entropy with different air quality grades

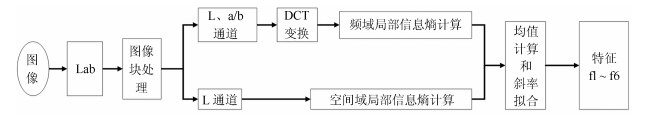
图 10 基于图像的空气质量等级检测方法流程图
Fig. 10 The flow chart of the image based air quality grade detection method
表 1 空气质量图像库
Table 1 Air quality image dataset
空气质量等级 优 良 轻度污染 中度污染 重度污染 严重污染 图像数量(幅) 15 13 15 16 16 25  下载: 导出CSV
表 2 基于图像检测空气质量等级通用模型所用特征总结
Table 2 The summary of features used in the general model of air quality grade detection based on images
特征序号 特征意义 f1$ \sim $f2 灰度通道空间域局部信息熵均值和斜率 f3$ \sim $f4 灰度通道频域局部信息熵均值和斜率 f5$ \sim $f6 颜色通道频域局部信息熵均值和斜率
下载: 导出CSV
表 3 六种方法性能对比
Table 3 The performance comparison of the six methods
方法 $mean_{\rm LCC}$ $mean_{\rm SROCC}$ TIME (s) $var_{\rm LCC}$ $var_{\rm SROCC}$ $mean_{acc(0)}$ $mean_{acc(1)}$ SSEQ [24] 0.8400 0.8384 1 345.3 0.0024 0.0035 0.7318 0.9400 IQALE-a [25] 0.8283 0.7770 1 892.1 0.0038 0.0067 0.7342 0.9235 IQALE-b [25] 0.8195 0.7791 1 912.6 0.0048 0.0075 0.7127 0.9336 IQALE-a, b [25] 0.8142 0.7618 2 828.0 0.0041 0.0076 0.7218 0.9183 Chen等[21] 0.84372 0.8145 26 485.1 0.0037 0.0049 0.7370 0.9450 GIST [27] 0.8300 0.8136 32.69 0.0018 0.0021 0.7099 0.9344 Alexnet [28] 0.8807 0.8743 16 290.0 0.0015 0.0019 0.6818 0.9250 Our-a 0.9002 0.8598 966.9 0.0011 0.0023 0.8110 0.9728 Our-b 0.8915 0.8595 971.5 0.0016 0.0028 0.7954 0.9730 Our-a, b 0.8993 0.8596 1 343.8 0.0010 0.0025 0.8126 0.9744
下载: 导出CSV
表 4 局部块大小对方法性能的影响
Table 4 The influence of the size of the local block on our method
局部块大小 $mean_{\rm LCC}$ $mean_{\rm SROCC}$ TIME (s) $var_{\rm LCC}$ $var_{\rm SROCC}$ $mean_{acc(0)}$ $mean_{acc(1)}$ $2\times 2$ 0.8662 0.8818 15 071.33 0.0008 0.0008 0.7074 0.9671 $4\times 4$ 0.9093 0.8911 3 661.60 0.0005 0.0009 0.8150 0.9769 $8\times 8$ 0.9002 0.8598 966.92 0.0011 0.0023 0.8110 0.9728 $16\times 16$ 0.8865 0.8524 310.18 0.0018 0.0029 0.7955 0.9682 $32\times 32$ 0.8551 0.8381 128.99 0.0035 0.0048 0.7670 0.9508
下载: 导出CSV
表 5 局部熵百分比对方法性能的影响
Table 5 The influence of the percentage of the local entropy on our method
局部熵百分比 $mean_{\rm LCC}$ $mean_{\rm SROCC}$ TIME (s) $var_{\rm LCC}$ $var_{\rm SROCC}$ $mean_{acc(0)}$ $mean_{acc(1)}$ 100 % 0.9002 0.8598 966.92 0.0011 0.0023 0.8110 0.9728 90 % 0.8930 0.8635 952.17 0.0013 0.0027 0.8116 0.9697 80 % 0.8889 0.8585 948.09 0.0015 0.0027 0.8073 0.9665 70 % 0.8864 0.8528 945.01 0.0014 0.0029 0.8001 0.9636 60 % 0.8834 0.8443 938.72 0.0013 0.0028 0.7974 0.9613
下载: 导出CSV
表 6 尺度个数对方法性能的影响
Table 6 The influence of the number of scales on our method
尺度 $mean_{\rm LCC}$ $mean_{\rm SROCC}$ TIME (s) $var_{\rm LCC}$ $var_{\rm SROCC}$ $mean_{acc(0)}$ $mean_{acc(1)}$ 1 0.9002 0.8598 966.92 0.0011 0.0023 0.8110 0.9728 2 0.8810 0.8348 1272.96 0.0020 0.0041 0.7934 0.9656 3 0.8646 0.8124 1363.92 0.0027 0.0057 0.7729 0.9511 4 0.8390 0.7857 1393.75 0.0027 0.0054 0.7482 0.9313
下载: 导出CSV
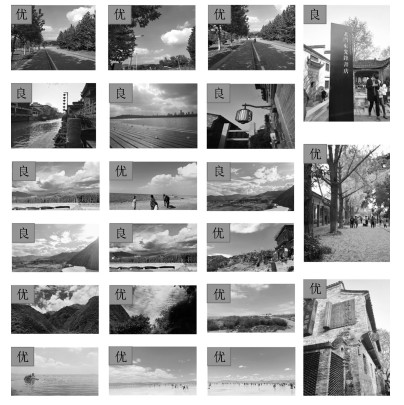
表 7 适用性实验数据集
Table 7 Applicability experiment datasets
数据集 图像数量(幅) 采集设备 Ⅰ 21 iphone6s等 Ⅱ 326 未知 Ⅲ 247 OPPO R7s
下载: 导出CSV
表 8 本文方法在数据集Ⅱ和数据集Ⅲ上的测试结果
Table 8 Testing results of the proposed method on Dataset Ⅱ and Dataset Ⅲ
数据集 LCC SROCC ACC(0) ACC(1) Ⅱ 0.6609 0.6827 0.6460 0.8497 Ⅲ 0.6411 0.6762 0.6032 0.8543
下载: 导出CSV
表 9 本文方法在空气质量图像库上的测试结果
Table 9 The testing results of the proposed method on the air quality image dataset
数据集 LCC SROCC ACC(0) ACC(1) 空气质量图像库 0.8721 0.8872 0.6700 0.9300
下载: 导出CSV
-
[1] 李旭红.构建符合我国国情的综合性环境税收体系.中国财政, 2017, 736(11): 26-28 http://www.wanfangdata.com.cn/details/detail.do?_type=perio&id=zgcz201711014Li Xu-Hong. A comprehensive environmental taxation system construction in line with Chinese national conditions. China State Finance, 2017, 736(11): 26-28 http://www.wanfangdata.com.cn/details/detail.do?_type=perio&id=zgcz201711014 [2] Turner M C, Krewski D, Diver W R, et al. Ambient air pollution and cancer mortality in the cancer prevention study Ⅱ. Environmental Health Perspectives, 2017, 125(8): 087013-1-087013-10 doi: 10.1289/EHP1249 [3] 郭尚书.基于数字摄像的大气能见度检测方法与系统实现.华中科技大学, 中国, 2014Guo Shang-Shu. Visibility Detection Method and System Design Based on Digital Photography[Master thesis]. Huazhong University of Science and Technology, China, 2014 [4] 卓力, 胡笑尘, 姜丽颖, 等.一种基于暗原色先验的空气质量指数估计方法: CN. CN104809467A, 2015Zhuo Li, Hu Xiao-Chen, Jiang Li-Ying, et al. A Method of Air Quality Index Estimation Based on Dark Channel Prior: CN. CN104809467A, 2015 [5] Zhang Z, Ma H, Fu H, et al. Outdoor air quality inference from single image. In: Proceedings of the 2015 International Conference on Multimedia Modeling. Sydney, Australia: MMM, 2015, 8936: 13-25 [6] Zamora E. Using image processing techniques to estimate the air quality. McNair Scholars Research Journal, 2012, 189-194 [7] Wong C J, Matjafri M Z, Abdullah K, et al. Temporal and spatial air quality monitoring using internet surveillance camera and ALOS satellite image. In: Proceedings of the 2009 IEEE Aerospace Conference Proceedings. Big Sky, MT, USA: IEEE, 2009. 1-7 [8] Zhang X, Liu M C. System and method for image quality enhancement by reducing the effects of air pollution and haze: US. US8204329, 2012 [9] Yang W M, Chen X, Liao Q M. Air quality evaluation based on image defogging. Applied Mechanics and Materials, 2014, 513-517: 3077-3080 doi: 10.4028/www.scientific.net/AMM.513-517.3077 [10] Yang W M, Chen X, Liao Q M. Air quality evaluation based on local normalized image contrast. Applied Mechanics and Materials, 2014, 511-512: 413-416 doi: 10.4028/www.scientific.net/AMM.511-512.413 [11] Wang H, Yuan X, Wang X, et al. Real-time air quality estimation based on color image processing. In: Proceedings of the 2015 Visual Communications and Image Processing Conference. Singapore: IEEE, 2015. 326-329 [12] Wong C J, Lim H S, Matjafri M Z, et al. Image data transfer over the internet protocol for air quality studies. In: Proceedings of the 2006 SPIE Defense and Security Symposium. Stockholm, Sweden: SPIE, 2006. 6233: 62330Z–62330Z-14 [13] Saleh N M, Lim H S, Matjafri M Z, et al. Air quality derivation utilizing Landsat TM image over Penang, Malaysia. In: Proceedings of the Third International Conference on Recent Advances in Space Technologies. Istanbul, Turkey: IEEE, 2007. 259-263 [14] Xu-Wen L I, Niu Z C, Wang J S, et al. Scene visibility retrieved from remotely sensed image and its correspondence with ground air quality monitoring data. Administration and Technique of Environmental Monitoring, 2011, 23(1): 20-27 http://www.wanfangdata.com.cn/details/detail.do?_type=perio&id=hjjcglyjs201101005 [15] Lim H S, Matjafri M Z. Retrieval of air quality information using image processing technique. In: Proceedings of the 2007 SPIE - The International Society for Optical Engineering. San Diego, USA: SPIE, 2007. 6541(107): 287-291 [16] Zhan Y, Zhang R, Wu Q, et al. A new haze image database with detailed air quality information and a novel no-reference image quality assessment method for haze images. In: Proceedings of the 2016 IEEE International Conference on Acoustics, Speech and Signal Processing. Shanghai, China: IEEE, 2016. 1095-1099 [17] Wong C J, Matjafri M Z, Abdullah K, et al. Using image processing technique for the studies on temporal development of air quality. In: Proceedings of the 2007 Conference on Computer Graphics, Imaging and Visualisation. Bangkok, Thailand: IEEE, 2007. 287-291 [18] Feng C, Wang W, Tian Y, et al. Estimate air quality based on mobile crowd sensing and big data. In: Proceedings of the 18th International Symposium on A World of Wireless, Mobile and Multimedia Networks. Macau, China: IEEE, 2017. 1-9 [19] Liu X, Song Z, Ngai E, et al. PM2.5 monitoring using images from smartphones in participatory sensing. In: Proceedings of the 2015 Computer Communications Workshops. Hong Kong, China: IEEE, 2015. 630-635 [20] He K, Sun J, Tang X. Single image haze removal using dark channel prior. In: Proceedings of the 2009 IEEE Conference on Computer Vision and Pattern Recognition. Miami, USA: IEEE, 2009. 1956-1963 [21] Chen X, Li Y, Li D. An efficient method for air quality evaluation via ANN-based image recognition. In: Proceedings of theSecond International Conference on Artificial Intelligence and Industrial Engineering. Beijing, China: AⅡE, 2016. 253-256 [22] Pan Z, Yu H, Miao C, Leung C. Crowdsensing air quality with camera-enabled mobile devices. In: Proceedings of the Twenty-Ninth AAAI Conference on Innovative Applications. San Francisco, USA: AAAI, 2017. 4728-4733 [23] Sekine Y, Katori R. Indoor air quality monitoring via it network colorimetric monitoring of formaldehyde in indoor environment using image transmission of mobile phone. In: Proceedings of the 2009 ICCAS-SICE. Fukuoka, Japan: ICCAS-SICE, 2009. 4041-4046 [24] Liu L, Liu B, Huang H, et al. No-reference image quality assessment based on spatial and spectral entropies. Signal Processing Image Communication, 2014, 29(8): 856-863 doi: 10.1016/j.image.2014.06.006 [25] Gabarda S, Cristóbal G, Goel N. Anisotropic blind image quality assessment: survey and analysis with current methods. Journal of Visual Communication and Image Representation, 2018, 52: 101-105 doi: 10.1016/j.jvcir.2018.02.008 [26] 徐琳, 陈强, 汪青.色彩熵在图像质量评价中的应用.中国图象图形学报, 2015, 20(12): 1583-1592 http://www.wanfangdata.com.cn/details/detail.do?_type=perio&id=zgtxtxxb-a201512003Xu Lin, Chen Qiang, Wang Qing. Application of color entropy to image quality assessment. Journal of Image and Graphics, 2015, 20(12): 1583-1592 http://www.wanfangdata.com.cn/details/detail.do?_type=perio&id=zgtxtxxb-a201512003 [27] Oliva A, Torralba A. Modeling the shape of the scene: A holistic representation of the spatial envelope. International Journal of Computer Vision, 2001, 42(3): 145-175 doi: 10.1023/A:1011139631724 [28] Krizhevsky A, Sutskever I, Hinton G E. ImageNet classification with deep convolutional neural networks. In: Proceedings of the 2012 International Conference on Neural Information Processing Systems. Doha, Qatar: ICONIP, 2012. 1097-1105 -

 下载:
下载:

计量
- 文章访问数: 1905
- HTML全文浏览量: 673
- PDF下载量: 324
- 被引次数: 0
