

-
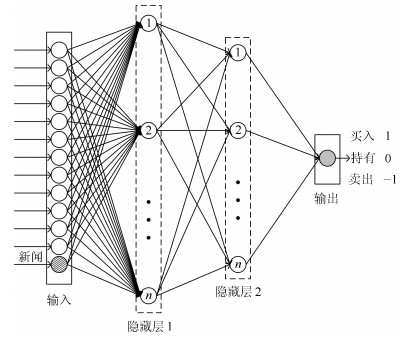
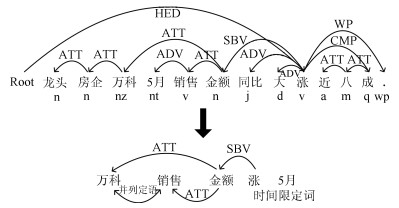
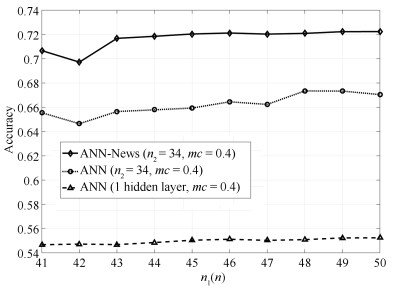
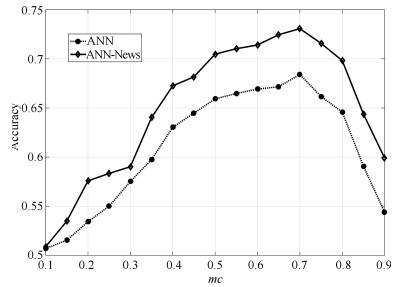
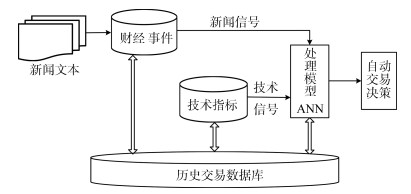
摘要: 股票自动交易系统属于典型的复杂系统,其成功的关键是如何对股价进行有效的预测与决策.股价受多种信息的影响,但传统的自动交易模型多建立在历史交易数据的基础上.针对上述问题,本文综合利用新闻文本数据与股价技术指标数据,基于人工神经网络(Artificial neural netuorks,ANN)方法设计了一种多源数据驱动的股票自动交易决策模型.本文首先分析了各类财经新闻的特点及其对股价的影响,然后设计了相应模板抽取了中文文本中的财经新闻事件;在此基础上,设计了历史股价和新闻事件数据共同驱动的ANN-News模型,并利用实际数据验证了模型的有效性.实验发现,ANN-News模型比传统的机器学习类模型股价预测准确率提升约4%,收益率提升约7%.Abstract: Automatic trading systems are typical complex systems, and a successful automatic trading system should be excellent at prediction and decision. Stock prices are affected by the information from various sources, while traditional automatic trading systems only consider the historical trading data. For this issue, we design an automatic trading framework by considering the signals from stock prices and new information based on artificial neural networks. Specifically, we first analyze various kinds of financial events and their corresponding effects on stock prices, and then extract the financial events that have prominent effects on stock prices. Next, we design an automatic trading model driven by stock prices and financial event data. Experiments on real world datasets show that the proposed ANN-News model outperforms the conventional machine learning models by about 4% in prediction precision and 7% in return, respectively.
-
Key words:
- Neural networks /
- data driven /
- automatic trading /
- decision model
1) 本文责任编委 赵勇 -
表 1 金融事件抽取模板
Table 1 Template of the extraction of financial events
类型 事件 触发词($T_r$) 方面词($A$) 依存路径(Path) 1 股价 股价上涨 上/涨 股票 $E_s/E_c \xrightarrow{\rm SBV} T_r$ 股价下跌 下/跌 股价 2 业绩 公司业绩上扬 上/扬 业绩 公司业绩下跌 下/跌 3 声誉 公司声誉提升 点赞 捐赠、公益 $E_s/E_c \xrightarrow{\rm ATT} A \xrightarrow{\rm SBV} T_r$ 公司声誉受损 下滑 口碑 4 利润 公司利润上升 上/升 利润 公司利润下滑 下/滑 5 负债 公司负债良好 良好 负债/债务 $E_s/E_c \xrightarrow{\rm ATT} T_r \xrightarrow{\rm ATT} C$ 公司负债堪忧 堪忧 6 高层 公司高层变动 变动/调整 董事长、CEO $E_c \xrightarrow{\rm ATT} A \xrightarrow{\rm SBV} T_r$ 7 业务 公司业务扩张 扩张 业务 公司合作 合作 公司($E_c^{(A)}, E_c^{(B)}$) $\{E_c^{(A)} + E_c^{(B)}\}\xrightarrow{\rm SBV} T_r$ 公司并购 并购  下载: 导出CSV
表 2 技术指标信号介绍
Table 2 Introduction of technical indicators
指标 公式 买卖信号 MACD EMA(12)-EMA(26) $+1:MACD_{t-1} \le 0~\&~MACD_t>0$
$-1:MACD_{t-1} \ge 0\&MACD_t<0$ROC $P_t-P_{t-20}$ $+1:ROC_{t-1} \le 1 ~\&~ ROC_{t} >1$
$-1:ROC_{t-1} \ge 1 ~\&~ ROC_{t} < 1$TRB $P_t^{\rm Max}={\rm Max}(P_{t-1}, P_{t-2}, \cdots, P_{t-20})$
$P_t^{\rm Min}={\rm Min}(P_{t-1}, P_{t-2}, \cdots, P_{t-20})$$+1:P_t>P_t^{\rm Max}$; $-1:P_t \ge P_t^{\rm Min}$ A/D $\frac{P^{High}_t-P_{t-1}}{P^{High}_t-P^{Low}_{t-1}}$ $+1:A/D_t\ge0;~-1:A/D_t<1$ Dis $P_t/MA(60)$ $+1:Dis_t \ge 1$; $-1:Dis_t<1$ VMA MA(20)-MA(60) $+1:VMA_{t-1}<0~\&~VMA_t>0$
$+1:VMA_{t-1}\ge 0~\&~VMA_t<0$}EMV $\frac{Mid_t-Mid_{t-1}}{BoxRatio_t}$, $Mid_{t}=\frac{P^{High}_t+P^{Low}_t}{2}$ $+1:EMV_{t-1}\le 0 ~\&~ EMV_{t} > 0$
$-1:EMV_{t-1}\ge 0EMV_t<1$CCI $\frac{M_t-SM_t}{0.015D_t}, $其中$M_t=\frac{P_t+P_t^{High}+P_t^{Low}}{3}$ $+1: CCI_t <-200~or~CCI_t >CCI_{t-1}$
$-1:CCI_t >200~or~CCI_t \le CCI_{t-1}$S/R $Sup(60)_t=MA(60)_t-2\sigma(60)_t$
$Res(60)_t=MA(60)_t+2\sigma(60)_t$$+1:P_t>Sup(60)_t$; $-1:P_t < Res(60)_t$ RSI $100-\frac{100}{1+(\sum^{n-1}_{i=0}Up_{t-i}/n)(\sum^{n-1}_{i=0}Dw_{i-1}/n)}$ $+1:RSI_{t}<30~or~RSI_{t}>RSI_{t-1}$
$-1:RSI_{t}>70~or~RSI_{t}\le RSI_{t-1}$注:其中, $P_t$表示$t$日的收盘价, $P^{High}_t$表示$t$日的最高价, $P^{Low}_t$表示$t$日的最低价. $MA(n)$为过去$n$天的简单移动平均计算为: $\sum^{n-1}_{i=0}p_{t-i}/n$, $EMA(n)$为过去$n$天($n=12/26$)的指数移动平均计算为: $P_t/n+(1-1/n)EMA(n)_{t-1}$, 其中$EMA(n)_0=P_1$, $\sigma(n)_t$为过去$n$天$(n=60)$收盘价的标准差计算为: $\sqrt{\sum^t_{i=t-n}(P_i-MA(n)_t)^2/n}$, $Up_t$是$t$日较上一期价格上涨的幅度(Upward-price-change), $Dw_t$是$t$日较上一期价格下降的幅度(Downward-price-change). $SM_t=\frac{\sum^n_{i=1}M_{t-i+1}}{n}$, $D_t=\frac{\sum^n_{i=1}|M_{t-i+1}-SM_t|}{n}$, $BoxRatio_t = Vol_t/1\, 000(P_t^{High}-P_t^{Low})$. $\pm1$代表买入/卖出信号, 其他情况表示持有.
下载: 导出CSV
表 3 财经事件与股价收益统计分析
Table 3 Statistic on the relationship between financial events and stock returns
事件 I Freq. R0 (%) $d$ $p$ R1 (%) $d$ $p$ R2 (%) $d$ $p$ R5 (%) $d$ $p$ R10 (%) $d$ $p$ 股价上涨 2 1957 1.71 84 0.01 1.32 81 0.01 1.24 75 0.01 1.19 72 0.01 1.43 70 0.00 股价下跌 -2 2039 -0.92 82 0.00 -1.21 77 0.01 -1.21 69 0.00 -0.87 67 0.03 -0.70 67 0.00 公司业绩上扬 3 702 0.88 65 0.00 0.78 59 0.03 1.23 58 0.02 1.14 55 0.00 0.95 53 0.02 公司业绩下跌 -2 499 -0.59 54 0.04 -0.87 47 0.01 -0.75 51 0.30 -0.87 50 0.56 -0.71 48 0.42 公司声誉提升 2 415 0.41 63 0.05 0.44 59 0.27 0.38 56 0.37 0.29 57 0.54 0.23 49 0.15 公司声誉受损 -2 90 -0.26 51 0.05 -0.39 51 0.29 -0.15 50 0.05 -0.13 49 0.52 -0.16 47 0.04 公司利润上升 3 344 0.41 51 0.48 0.41 49 0.18 0.59 47 0.69 0.66 51 0.01 0.79 55 0.01 公司利润下滑 -3 200 -1.37 66 0.24 -0.88 64 0.10 -0.71 58 0.11 -0.49 53 0.04 -0.44 57 0.00 公司负债良好 1 189 0.13 54 0.15 0.34 51 0.47 -0.06 50 0.05 0.28 47 0.08 0.23 51 0.06 公司负债堪忧 -1 125 -0.15 56 0.01 -0.27 55 0.08 -0.66 57 0.01 -0.23 50 0.11 -0.25 59 0.04 公司高层变动 1 146 -0.13 51 0.19 0.08 60 0.45 -0.11 50 0.04 0.25 51 0.19 0.17 57 0.16 公司合作 1 137 0.16 49 0.00 0.19 50 0.36 0.05 50 0.11 0.09 56 0.32 0.14 51 0.04 公司业务扩张 1 147 0.24 51 0.12 0.58 49 0.15 -0.45 48 0.13 -0.16 49 0.24 0.46 49 0.31 公司并购 3 73 0.18 54 0.02 0.29 54 0.06 0.35 50 0.16 0.11 53 0.04 0.09 54 0.50 7 063 60 58 55 54 55
下载: 导出CSV
表 4 预定义影响力和收益$R_x$的关系
Table 4 Relationship between predefined impact and $R_x$
$R_x$ $r$ $p$ $R_0$ 0.805 0.000 $R_1$ 0.861 0.000 $R_2$ 0.821 0.000 $R_5$ 0.813 0.000 $R_{10}$ 0.801 0.001
下载: 导出CSV
表 5 数据集1技术信号与新闻信号收益统计
Table 5 Statistics of the returns generated by technical and news signals on Dataset 1
信号 买入(%) 卖出(%) $R_1$ $R_2$ $R_5$ $R_1$ $R_2$ $R_5$ MACD 0.146 0.123 0.339 -0.443 -0.510 -0.285 ROC 0.151 0.237 0.358 -0.062 -0.056 -0.097 A/D 0.103 0.187 0.350 -0.104 -0.024 0.309 Dis 0.057 0.129 0.199 -0.008 -0.025 0.015 VMA 0.330 0.628 1.156 -0.420 -0.415 -0.278 EMV 0.029 0.195 0.163 -0.024 -0.168 -0.169 TRB 0.345 0.459 0.925 -0.276 -0.247 -0.177 CCI 0.190 0.217 0.479 -0.054 0.063 0.118 SR 0.057 0.129 0.200 -0.005 -0.003 0.015 RSI 0.135 0.137 0.182 -0.017 0.105 0.029 新闻信号 1.019 0.847 0.515 -1.031 -0.614 -0.227
下载: 导出CSV
表 6 表现最佳的3组ANN参数组合
Table 6 The best three combinations of ANN model
$n_1$ $n_2$ $mc$ 数据集1 (%) 数据集2 (%) 训练集 测试集 训练集 测试集 1 50 26 0.3 71.53 70.65 69.65 67.38 2 48 30 0.1 73.79 71.89 68.27 66.05 3 49 34 0.4 78.60 72.03 74.14 71.77
下载: 导出CSV
表 7 ANN与ANN-News模型对比
Table 7 Comparison between ANN and ANN-News
$n_1$ $n_2$ $mc$ ANN (%) ANN-News (%) 训练集 测试集 训练集 测试集 1 50 26 0.3 71.53 70.65 69.65 67.38 2 48 30 0.1 73.79 71.89 68.27 66.05 3 49 34 0.4 78.60 72.03 74.14 71.77 4 49 34 0.7 69.14 65.17 78.08 72.58
下载: 导出CSV
表 8 ANN模型与经典模型对比
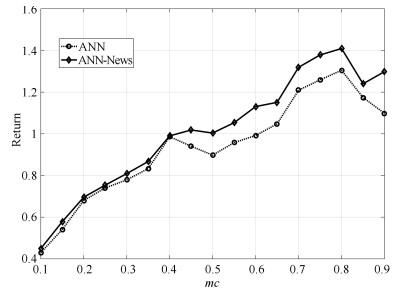
Table 8 The comparison among ANN and other classical models
准确率 收益率 ANN 0.682 (±0.04) 1.306 (±0.06) ANN-News 0.739(±0.02) 1.403 (±0.03) SVM 0.653 (±0.04) 1.024 (±0.09) SVM-News 0.692 (±0.06) 1.067 (±0.12) Naïve Bayes 0.641 (±0.06) 1.102 (±0.05) Naïve Bayes-News 0.687 (±0.08) 1.281 (±0.08)
下载: 导出CSV
-
[1] Ozturk M, Toroslu I H, Fidan G. Heuristic based trading system on Forex data using technical indicator rules. Applied Soft Computing, 2016, 43:170-186 doi: 10.1016/j.asoc.2016.01.048 [2] Nuij W, Milea V, Hogenboom F, Frasincar F, Kaymak U. An automated framework for incorporating news into stock trading strategies. IEEE Transactions on Knowledge and Data Engineering, 2014, 26(4):823-835 doi: 10.1109/TKDE.2013.133 [3] Wu Zhen, Wei Gang. One kind of optimal international security investment portfolio and consumption choice problem. Acta Automatica Sinica, 2003, 29(5):673-680 https://www.researchgate.net/publication/266997049_One_kind_of_optimal_control_problem_of_portfolio_and_consumption_choice_with_power_utility_function [4] 袁勇, 王飞跃.区块链技术发展现状与展望.自动化学报, 2016, 42(4):481-494 http://www.aas.net.cn/CN/Y2016/V42/I4/481Yuan Yong, Wang Fei-Yue. Blockchain:the state of the art and future trends. Acta Automatica Sinica, 2016, 42(4):481-494 http://www.aas.net.cn/CN/Y2016/V42/I4/481 [5] 王飞跃.人工社会、计算实验、平行系统-关于复杂社会经济系统计算研究的讨论.复杂系统与复杂性科学, 2004, 1(4):25-35 doi: 10.3969/j.issn.1672-3813.2004.04.002Wang Fei-Yue. Artificial societies, computational experiments, and parallel systems:a discussion on computational theory of complex social-economic systems. Complex Systems and Complexity Science, 2004, 1(4):25-35 doi: 10.3969/j.issn.1672-3813.2004.04.002 [6] 崔凯楠, 郑晓龙, 文丁, 赵学亮.计算实验研究方法及应用.自动化学报, 2013, 39(8):1157-1169 http://www.aas.net.cn/CN/abstract/abstract18148.shtmlCui Kai-Nan, Zheng Xiao-Long, Wen Ding, Zhao Xue-Liang. Researches and applications of computational experiments. Acta Automatica Sinica, 2013, 39(8):1157-1169 http://www.aas.net.cn/CN/abstract/abstract18148.shtml [7] Merrill A A. Behavior of Prices on Wall Street. New York:Analysis Press, 1966:15-31. [8] 郭欣, 王蕾, 宣伯凯, 李彩萍.基于有监督Kohonen神经网络的步态识别.自动化学报, 2017, 43(3):430-438 http://www.aas.net.cn/CN/Y2017/V43/I3/430Guo Xin, Wang Lei, Xuan Bo-Kai, Li Cai-Ping. Gait recognition based on supervised Kohonen neural network. Acta Automatica Sinica, 2017, 43(3):430-438 http://www.aas.net.cn/CN/Y2017/V43/I3/430 [9] 秦楚雄, 张连海.基于DNN的低资源语音识别特征提取技术.自动化学报, 2017, 43(7):1208-1219 http://www.aas.net.cn/CN/Y2017/V43/I7/1208Qin Chu-Xiong, Zhang Lian-Hai. Deep neural network based feature extraction for low-resource speech recognition. Acta Automatica Sinica, 2017, 43(7):1208-1219 http://www.aas.net.cn/CN/Y2017/V43/I7/1208 [10] Dash R, Dash P K. A hybrid stock trading framework integrating technical analysis with machine learning techniques. Journal of Finance and Data Science, 2016, 2(1):42-57 doi: 10.1016/j.jfds.2016.03.002 [11] Hsu M W, Lessmann S, Sung M C, Ma T J, Hohnson J E V. Bridging the divide in financial market forecasting:machine learners vs. financial economists. Expert Systems with Applications, 2016, 61:215-234 doi: 10.1016/j.eswa.2016.05.033 [12] Micola A R. Reviewed work:handbook of computational economics, Vol. 2:agent-based computational economics by L. Tesfatsion, K. L. Jud. Interfaces, 2007, 37(3):303-304 [13] Wang L X. Modeling stock price dynamics with fuzzy opinion networks. IEEE Transactions on Fuzzy Systems, 2017, 25(2):277-301 doi: 10.1109/TFUZZ.2016.2574911 [14] Wang L X. Dynamical models of stock prices based on technical trading rules part I:the models. IEEE Transactions on Fuzzy Systems, 2015, 23(4):787-801 doi: 10.1109/TFUZZ.2014.2327994 [15] Wang L X. Dynamical models of stock prices based on technical trading rules-part Ⅱ:analysis of the models. IEEE Transactions on Fuzzy Systems, 2015, 23(4):1127-1141 doi: 10.1109/TFUZZ.2014.2346244 [16] Wang L X. Dynamical models of stock prices based on technical trading rules-part Ⅲ:application to Hong Kong stocks. IEEE Transactions on Fuzzy Systems, 2015, 23(5):1680-1697 doi: 10.1109/TFUZZ.2014.2374193 [17] Kimoto T, Asakawa K, Yoda M, Takeoka M. Stock market prediction system with modular neural networks. In: Proceedings of 1990 IJCNN International Joint Conference on Neural Networks. San Diego, CA, USA: IEEE, 1990. [18] Saad E W, Prokhorov D V, Wunsch D C. Comparative study of stock trend prediction using time delay, recurrent and probabilistic neural networks. IEEE Transactions on Neural Networks, 1998, 9(6):1456-1470 doi: 10.1109/72.728395 [19] Dhamija A K, Bhalla V K. Exchange rate forecasting:comparison of various architectures of neural networks. Neural Computing and Applications, 2011, 20(3):355-363 doi: 10.1007/s00521-010-0385-5 [20] Ballings M, van den Poel D, Hespeels N, Gryp R. Evaluating multiple classifiers for stock price direction prediction. Expert Systems with Applications, 2015, 42(20):7046-7056 doi: 10.1016/j.eswa.2015.05.013 [21] Rosen R J. Merger momentum and investor sentiment:the stock market reaction to merger announcements. The Journal of Business, 2006, 79(2):987-1017 doi: 10.1086/jb.2006.79.issue-2 [22] Zhang X F. Information uncertainty and stock returns. The Journal of Finance, 2006, 61(1):105-137 doi: 10.1111/j.1540-6261.2006.00831.x [23] Schumaker R P, Zhang Y L, Huang C N, Chen H. Evaluating sentiment in financial news articles. Decision Support Systems, 2012, 53(3):458-464 doi: 10.1016/j.dss.2012.03.001 [24] Yuan Y. Market-wide attention, trading, and stock returns. Journal of Financial Economics, 2015, 116(3):548-564 doi: 10.1016/j.jfineco.2015.03.006 [25] Hong K S, Dennis A R, Yuan L Y. Trading on twitter:using social media sentiment to predict stock returns. Decision Sciences, 2017, 48(3):454-488 doi: 10.1111/deci.2017.48.issue-3 [26] Pagolu V S, Reddy K N, Panda G, Majhi B. Sentiment analysis of twitter data for predicting stock market movements. In: Proceedings of 2016 International Conference on Signal Processing, Communication, Power and Embedded System (SCOPES). Paralakhemundi, India: IEEE, 2016. [27] Kara Y, Acar Boyacioglu M, Baykan Ö B. Predicting direction of stock price index movement using artificial neural networks and support vector machines:the sample of the istanbul stock exchange. Expert Systems with Applications, 2011, 38(5):5311-5319 doi: 10.1016/j.eswa.2010.10.027 [28] Patel J, Shah S, Thakkar P, Kotecha K. Predicting stock and stock price index movement using Trend Deterministic Data Preparation and machine learning techniques. Expert Systems with Applications, 2015, 42(1):259-268 doi: 10.1016/j.eswa.2014.07.040 [29] 赵妍妍, 秦兵, 车万翔, 刘挺.中文事件抽取技术研究.中文信息学报, 2008, 22(1):3-8 doi: 10.3969/j.issn.1003-0077.2008.01.001Zhao Yan-Yan, Qin Bing, Che Wan-Xiang, Liu Ting. Research on Chinese event extraction. Journal of Chinese Information Processing, 2008, 22(1):3-8 doi: 10.3969/j.issn.1003-0077.2008.01.001 [30] Chen Z, Ji H. Language specific issue and feature exploration in Chinese event extraction. In: Proceedings of Human Language Technologies: The 2009 Annual Conference of the North American Chapter of the Association of Computational Linguistics. Boulder, Colorado, USA: ACM, 2009: 209-212 [31] 胡博磊, 贺瑞芳, 孙宏, 王文俊.基于条件随机域的中文事件类型识别.模式识别与人工智能, 2012, 25(3):445-449 doi: 10.3969/j.issn.1003-6059.2012.03.012Hu Bo-Lei, He Rui-Fang, Sun Hong, Wang Wen-Jun. Chinese event type recognition based on conditional random fields. Pattern Recognition and Artificial Intelligence, 2012, 25(3):445-449 doi: 10.3969/j.issn.1003-6059.2012.03.012 [32] 廖祥文, 陈兴俊, 魏晶晶, 陈国龙, 程学旗.基于多层关系图模型的中文评价对象与评价词抽取方法.自动化学报, 2017, 43(3):462-471 http://www.aas.net.cn/CN/Y2017/V43/I3/462Liao Xiang-Wen, Chen Xing-Jun, Wei Jing-Jing, Chen Guo-Long, Cheng Xue-Qi. A multi-layer relation graph model for extracting opinion targets and opinion words. Acta Automatica Sinica, 2017, 43(3):462-471 http://www.aas.net.cn/CN/Y2017/V43/I3/462 -

 下载:
下载:


计量
- 文章访问数: 2992
- HTML全文浏览量: 637
- PDF下载量: 775
- 被引次数: 0
